mdadm 1,4651,465
1/19/2018
4/3/2018
1
Host Metrics
>=4.6.1
Prometheus
Description
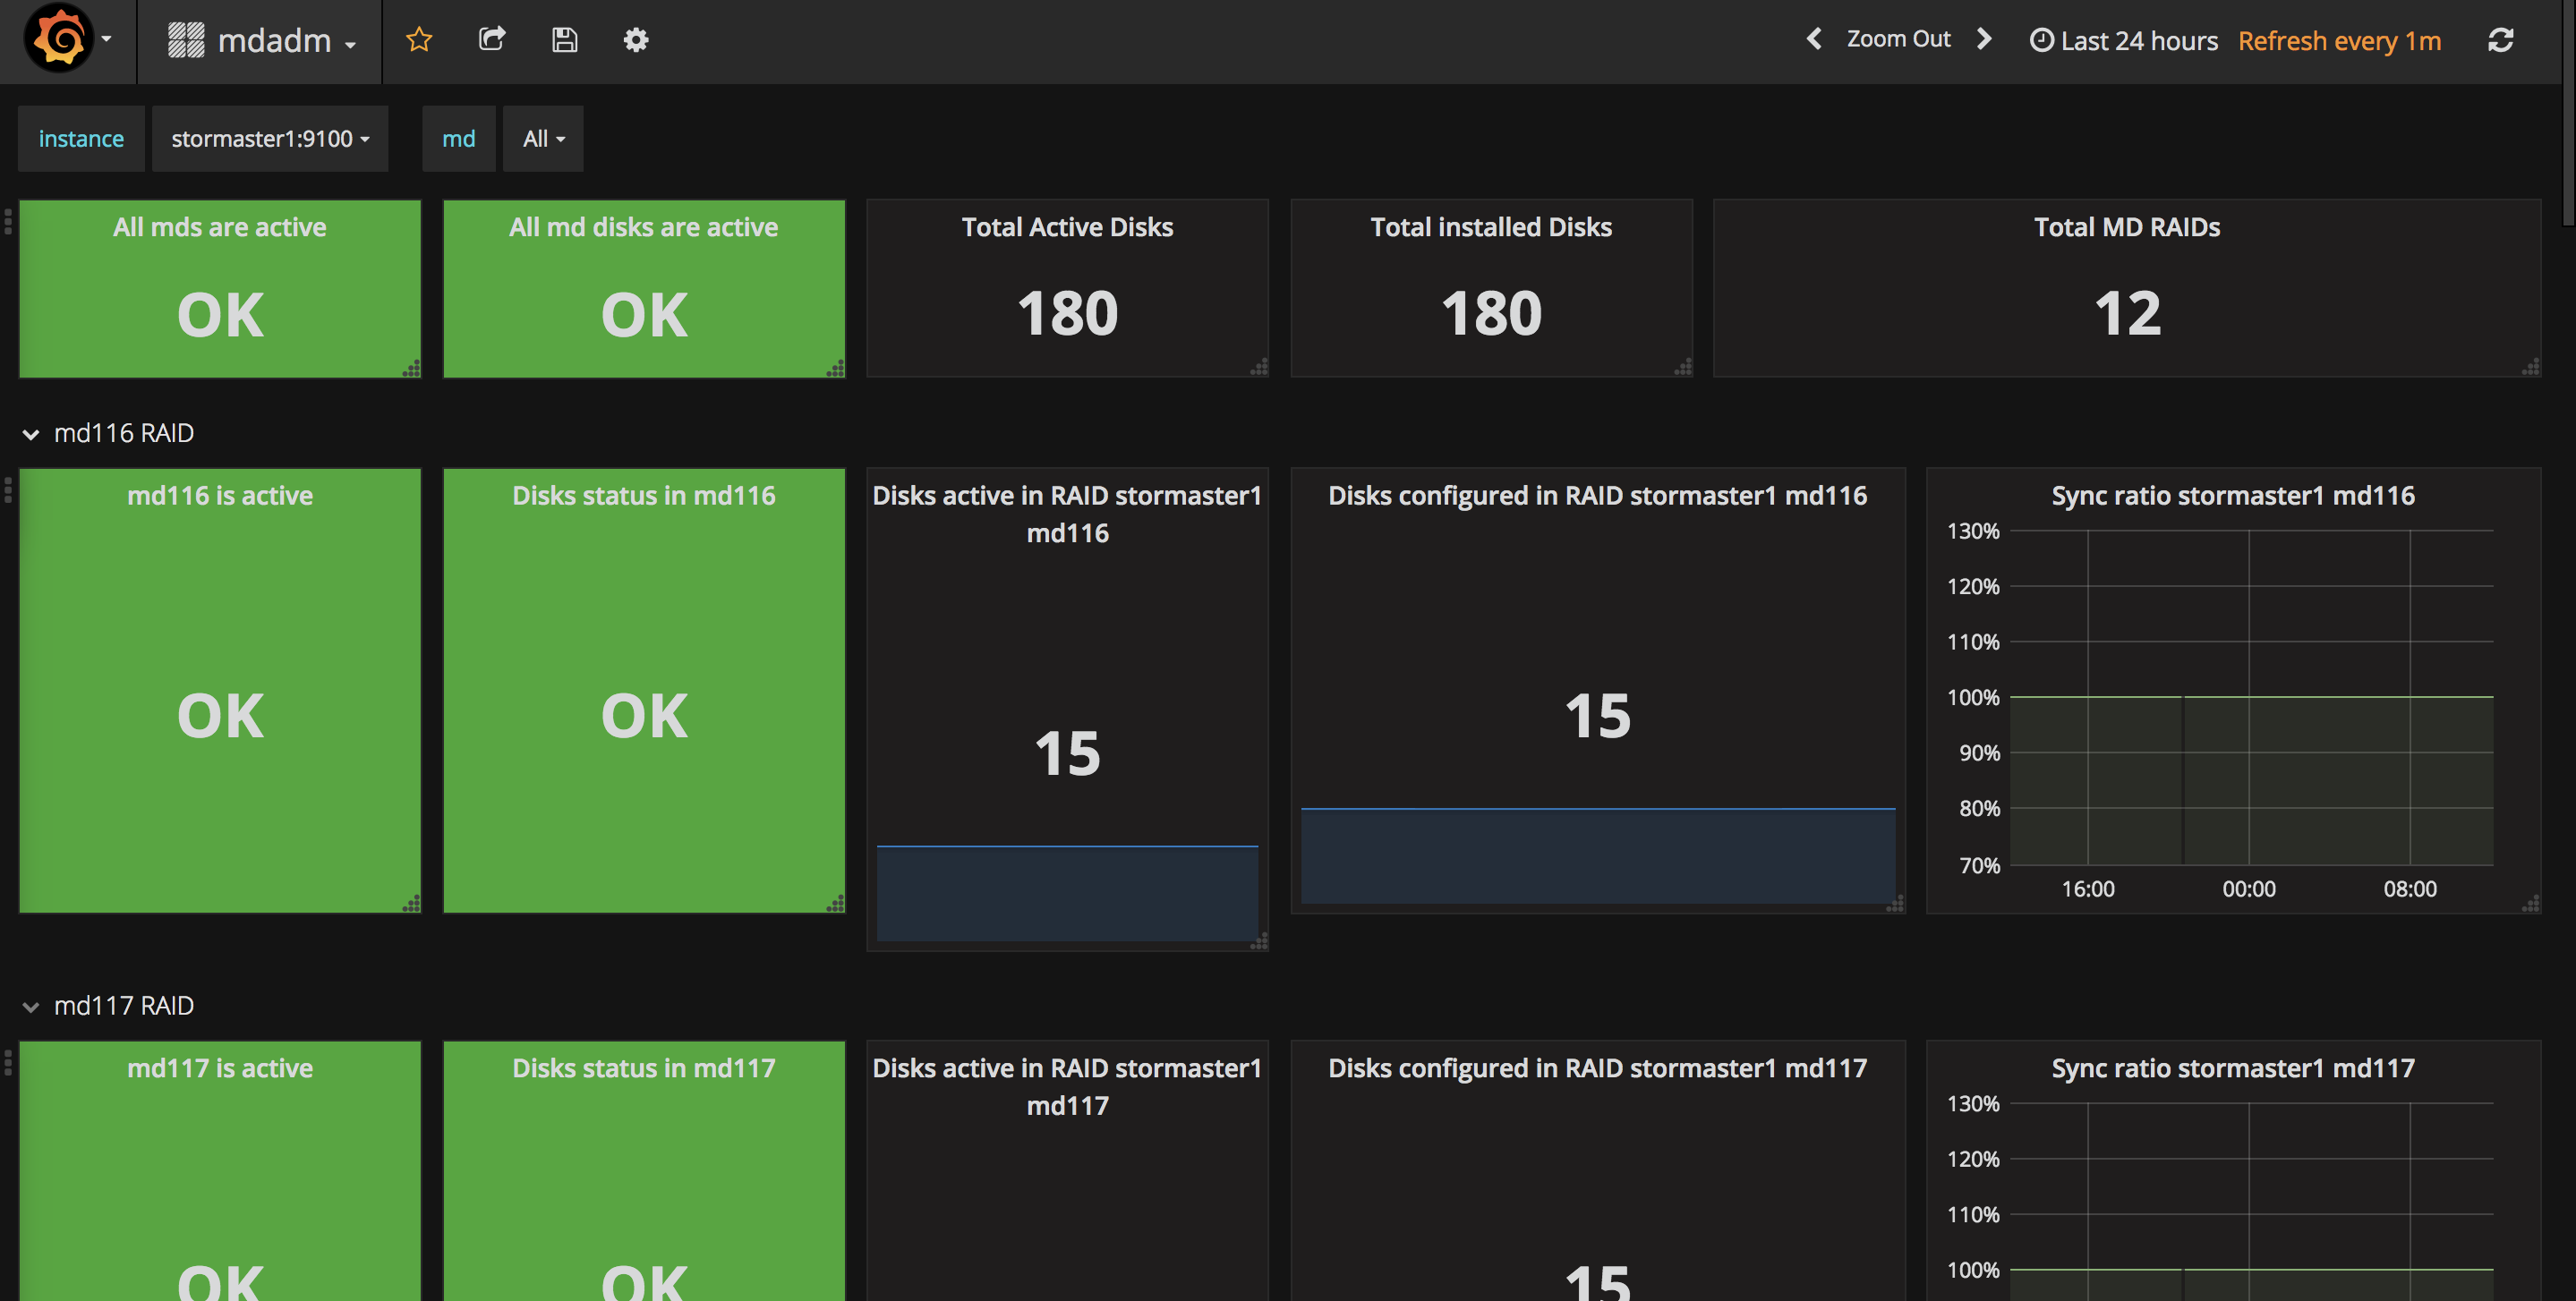
Prometheus node_exporter mdadm module dashboard. Per Server and per md view
Screenshots
Get Dashboard✕
Download
Copy to Clipboard
Prometheus node_exporter mdadm module dashboard. Per Server and per md view