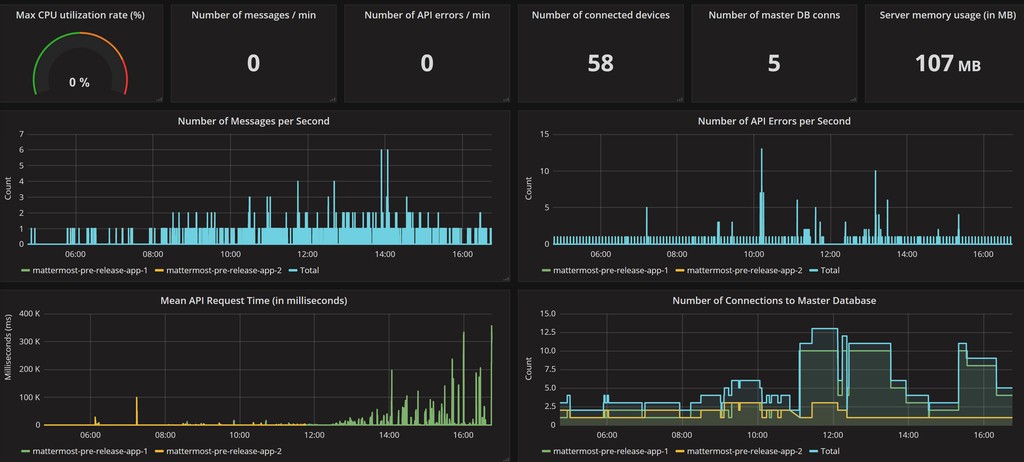
Mattermost Performance KPI Metrics 4,8104,810
6/26/2017
1/20/2022
2
Host Metrics
>=5.1.1
Prometheus
Description
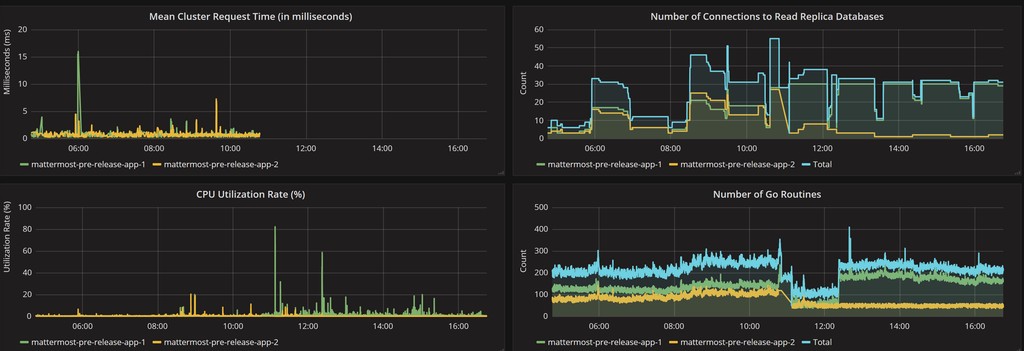
Mattermost dashboard to monitor KPI metrics
Screenshots
Used Metrics 1212
-
go_goroutines
-
go_memstats_alloc_bytes
mattermost_cluster_cluster_request_duration_seconds_count
mattermost_cluster_cluster_request_duration_seconds_sum
mattermost_db_master_connections_total
mattermost_db_read_replica_connections_total
mattermost_http_errors_total
mattermost_http_request_duration_seconds_count
mattermost_http_request_duration_seconds_sum
mattermost_http_websockets_total
mattermost_post_total
mattermost_process_cpu_seconds_total
Get Dashboard✕
Download
Copy to Clipboard