Mattermost Notification Health 4,4314,431
6/12/2024
10/1/2024
5
>=11.1.0
Prometheus
Description
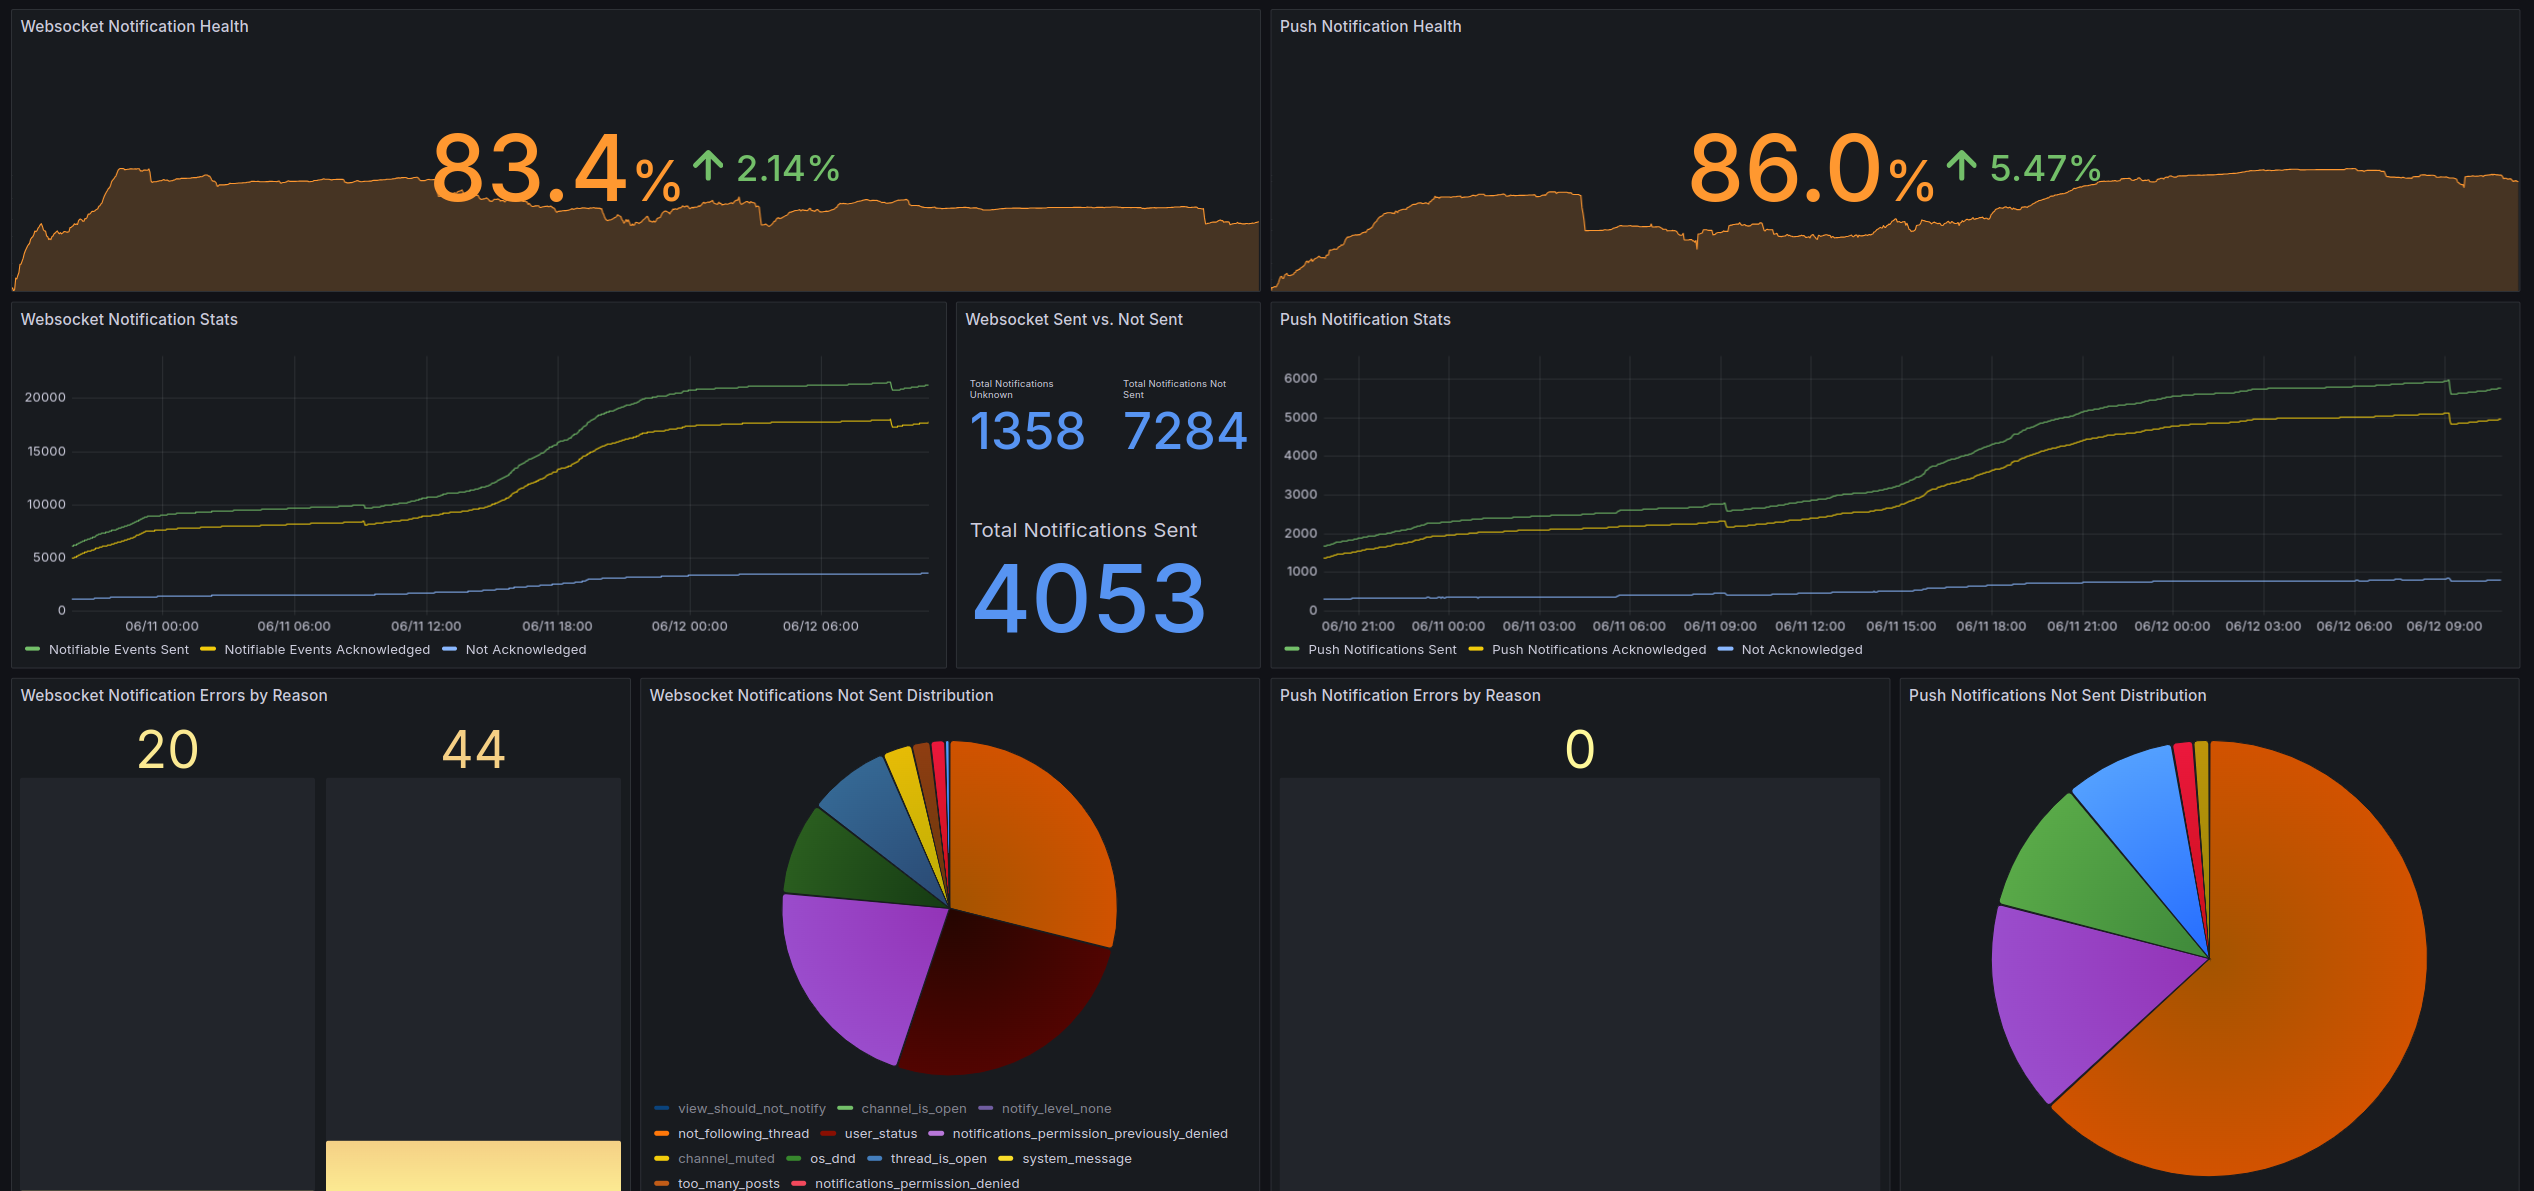
A dashboard displaying notification health metrics, and distributions around notifications that were not sent, both deliberate and indeliberate.
The dashboard is split in half by Websocket events (POSTED events from the server to web clients) and Push events (events sent to the push proxy to be received by mobile clients).
Screenshots
Used Metrics 66
mattermost_notifications_error
mattermost_notifications_not_sent
mattermost_notifications_success
mattermost_notifications_total
mattermost_notifications_total_ack
mattermost_notifications_unsupported
Get Dashboard✕
Download
Copy to Clipboard