Mastodon Stats 2,0112,011
11/25/2022
11/29/2022
5
>=9.2.6
Prometheus
Description
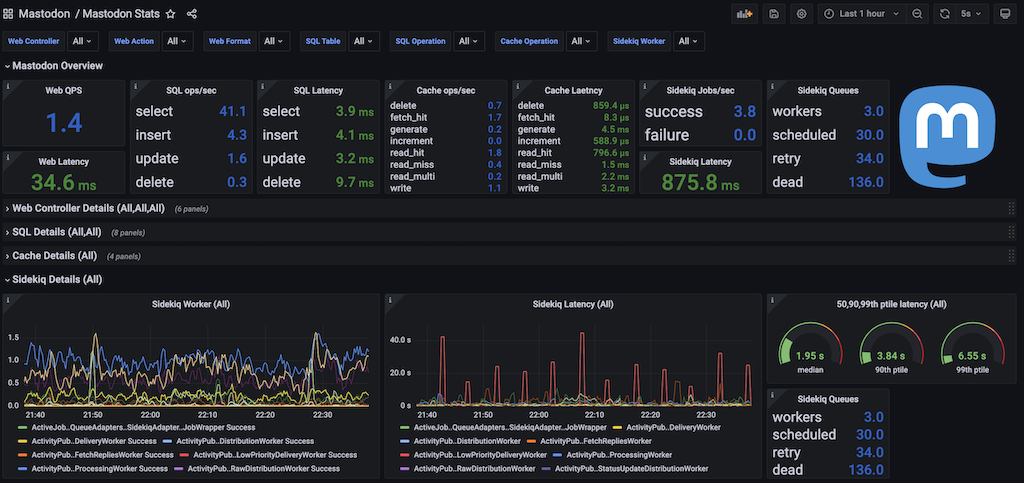
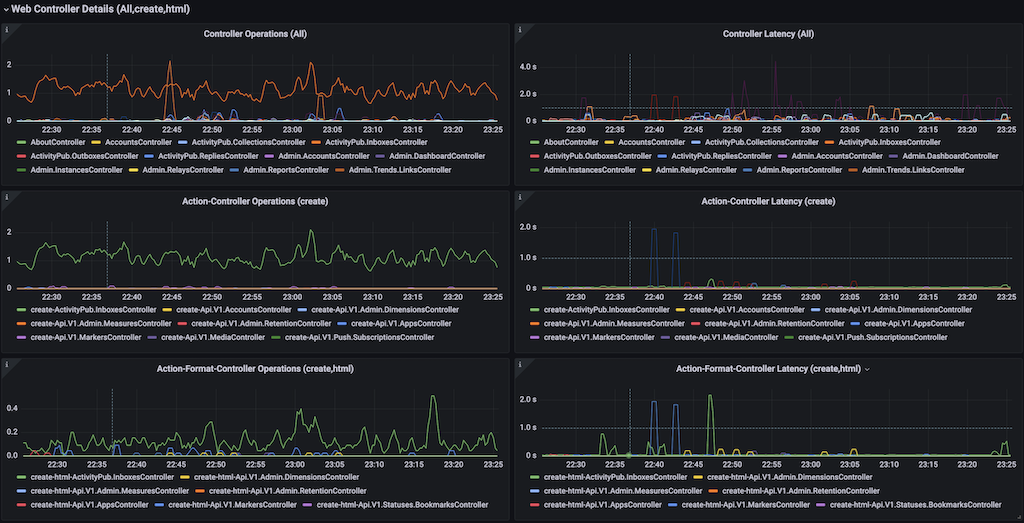
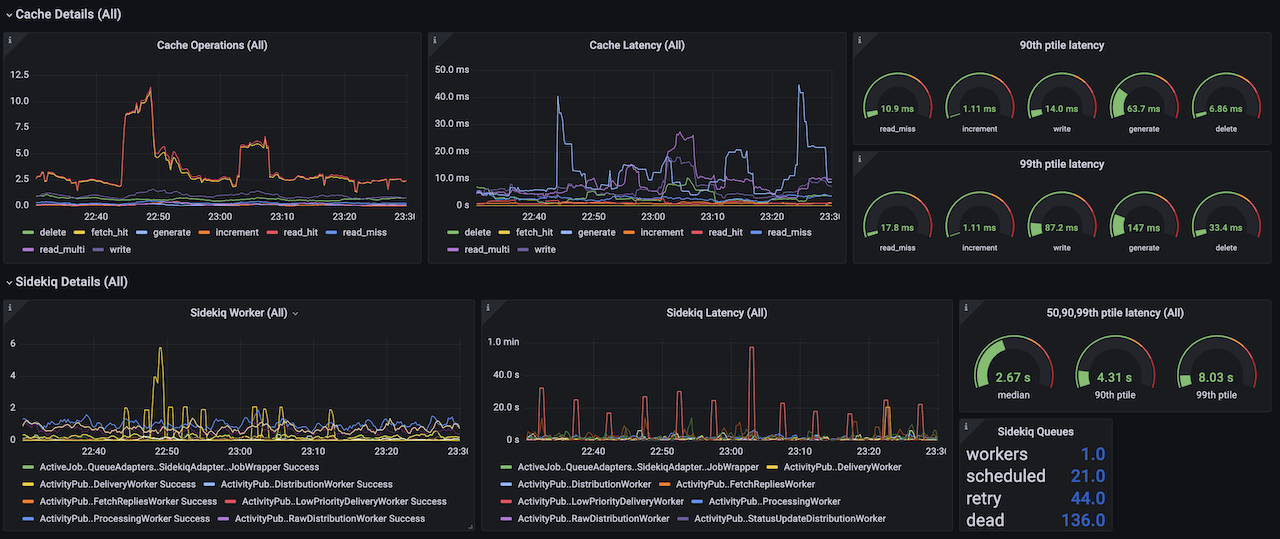
A comprehensive monitoring dashboard based on Mastodon's Prometheus statsd exporter
Screenshots
Used Metrics 1414
mastodon_cache_duration_count
mastodon_cache_duration_sum
mastodon_controller_duration_count
mastodon_controller_duration_sum
mastodon_db_operation_count
mastodon_db_operation_sum
mastodon_sidekiq_dead_size
mastodon_sidekiq_retry_size
mastodon_sidekiq_scheduled_size
mastodon_sidekiq_worker_failure_total
mastodon_sidekiq_worker_processing_time_count
mastodon_sidekiq_worker_processing_time_sum
mastodon_sidekiq_worker_success_total
mastodon_sidekiq_workers_size
Get Dashboard✕
Download
Copy to Clipboard