MassTransit - Messages Monitoring 788788 5.0 (1 reviews)
12/22/2022
12/23/2022
1
AzureDockerRabbitMQ
>=9.3.1
Prometheus
Description
MassTransit is a message-based distributed application framework for .NET http://masstransit-project.com.
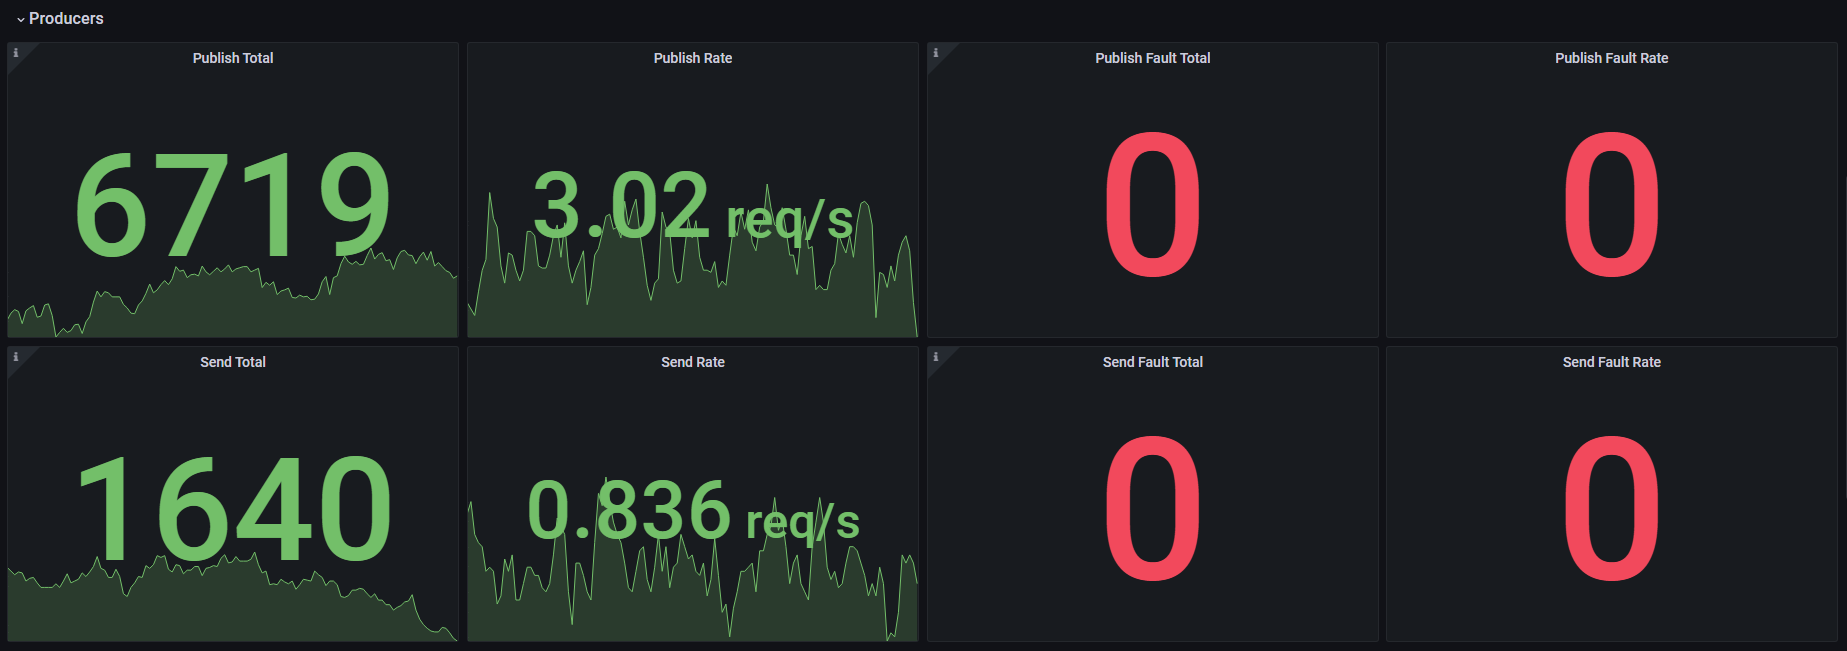
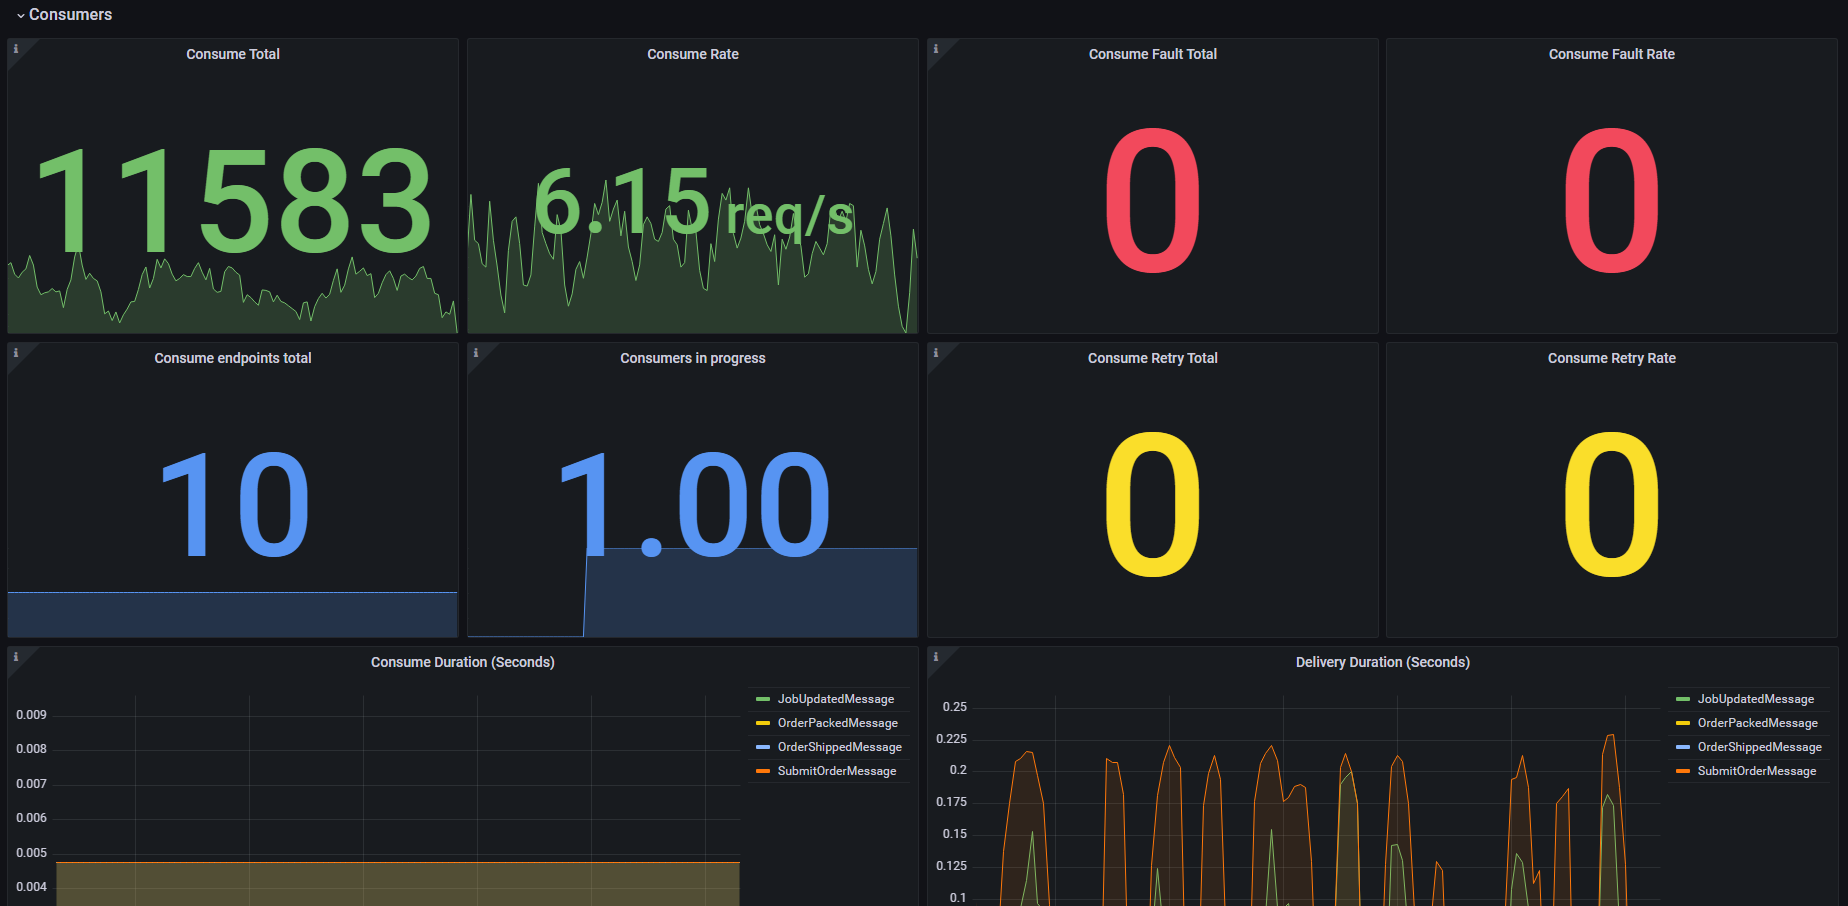
MassTransit supports Prometheus metric capture, which provides useful observability into the bus, endpoints, consumers, and messages.
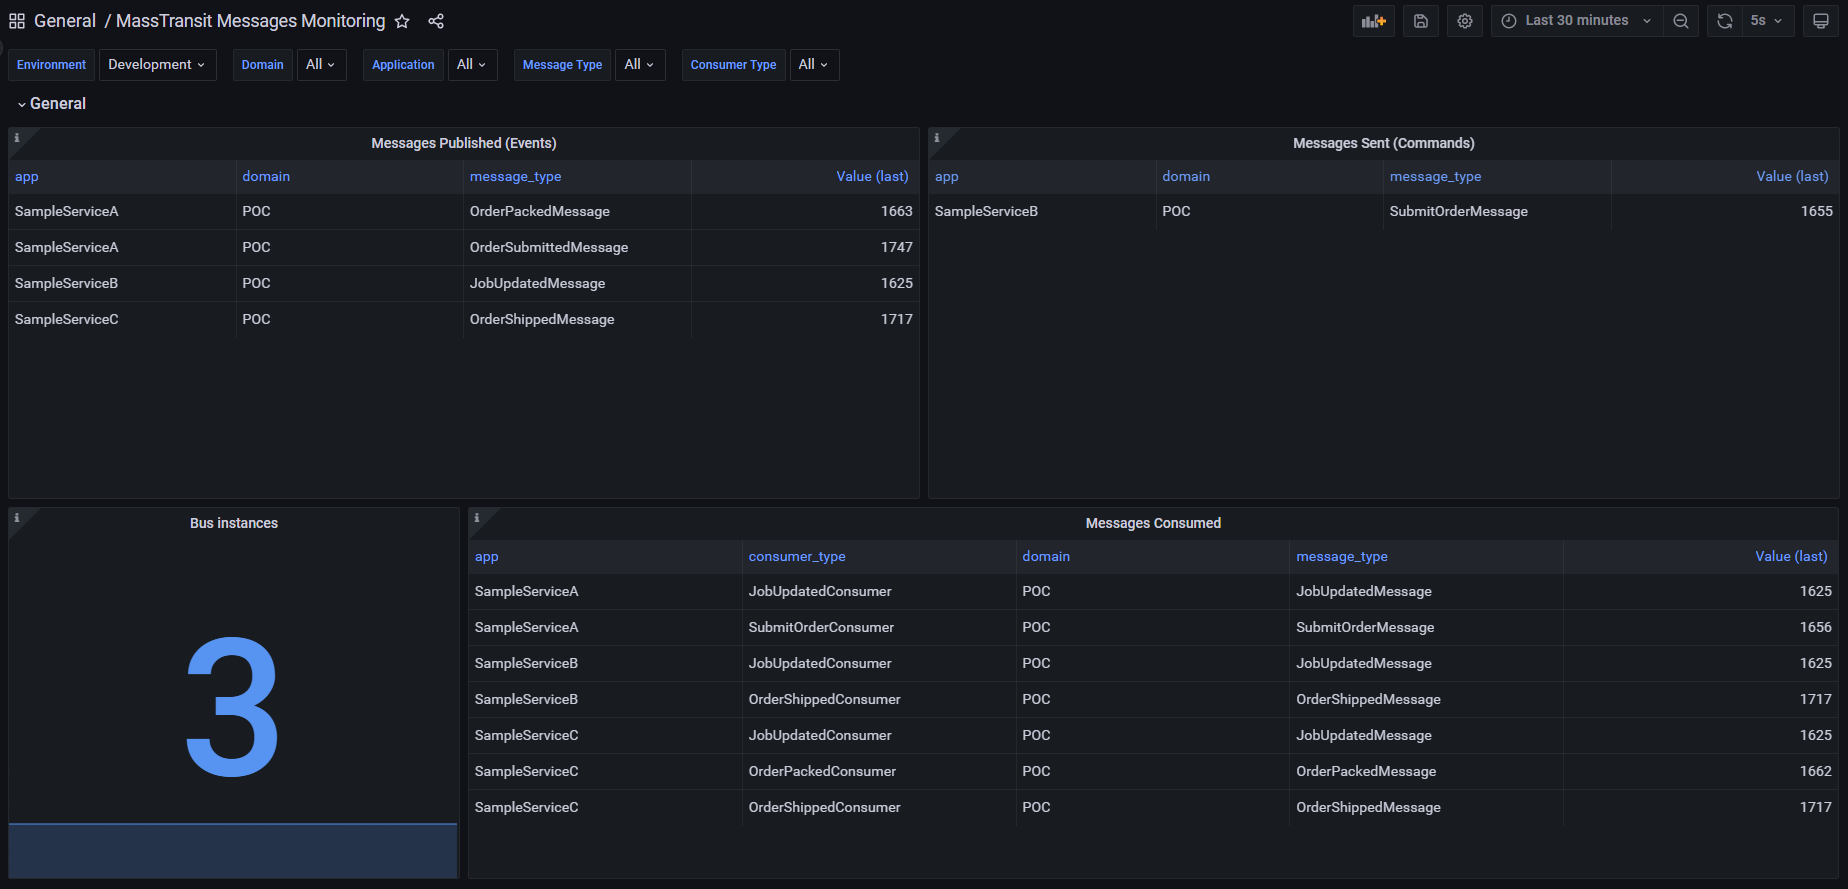
This dashboard shows the messages published and sent using MassTransit framework.
Screenshots
Used Metrics 1212
mt_bus
mt_consume_duration_seconds_bucket
mt_consume_fault_total
mt_consume_retry_total
mt_consume_total
mt_consumer_in_progress
mt_delivery_duration_seconds_bucket
mt_endpoint
mt_publish_fault_total
mt_publish_total
mt_send_fault_total
mt_send_total
Get Dashboard✕
Download
Copy to Clipboard