Longhorn Dashboard
1,043

Created 1/16/2025
Updated 1/16/2025
Revision 1
Grafana Version >=11.3.1
Datasources
Prometheus

Overview

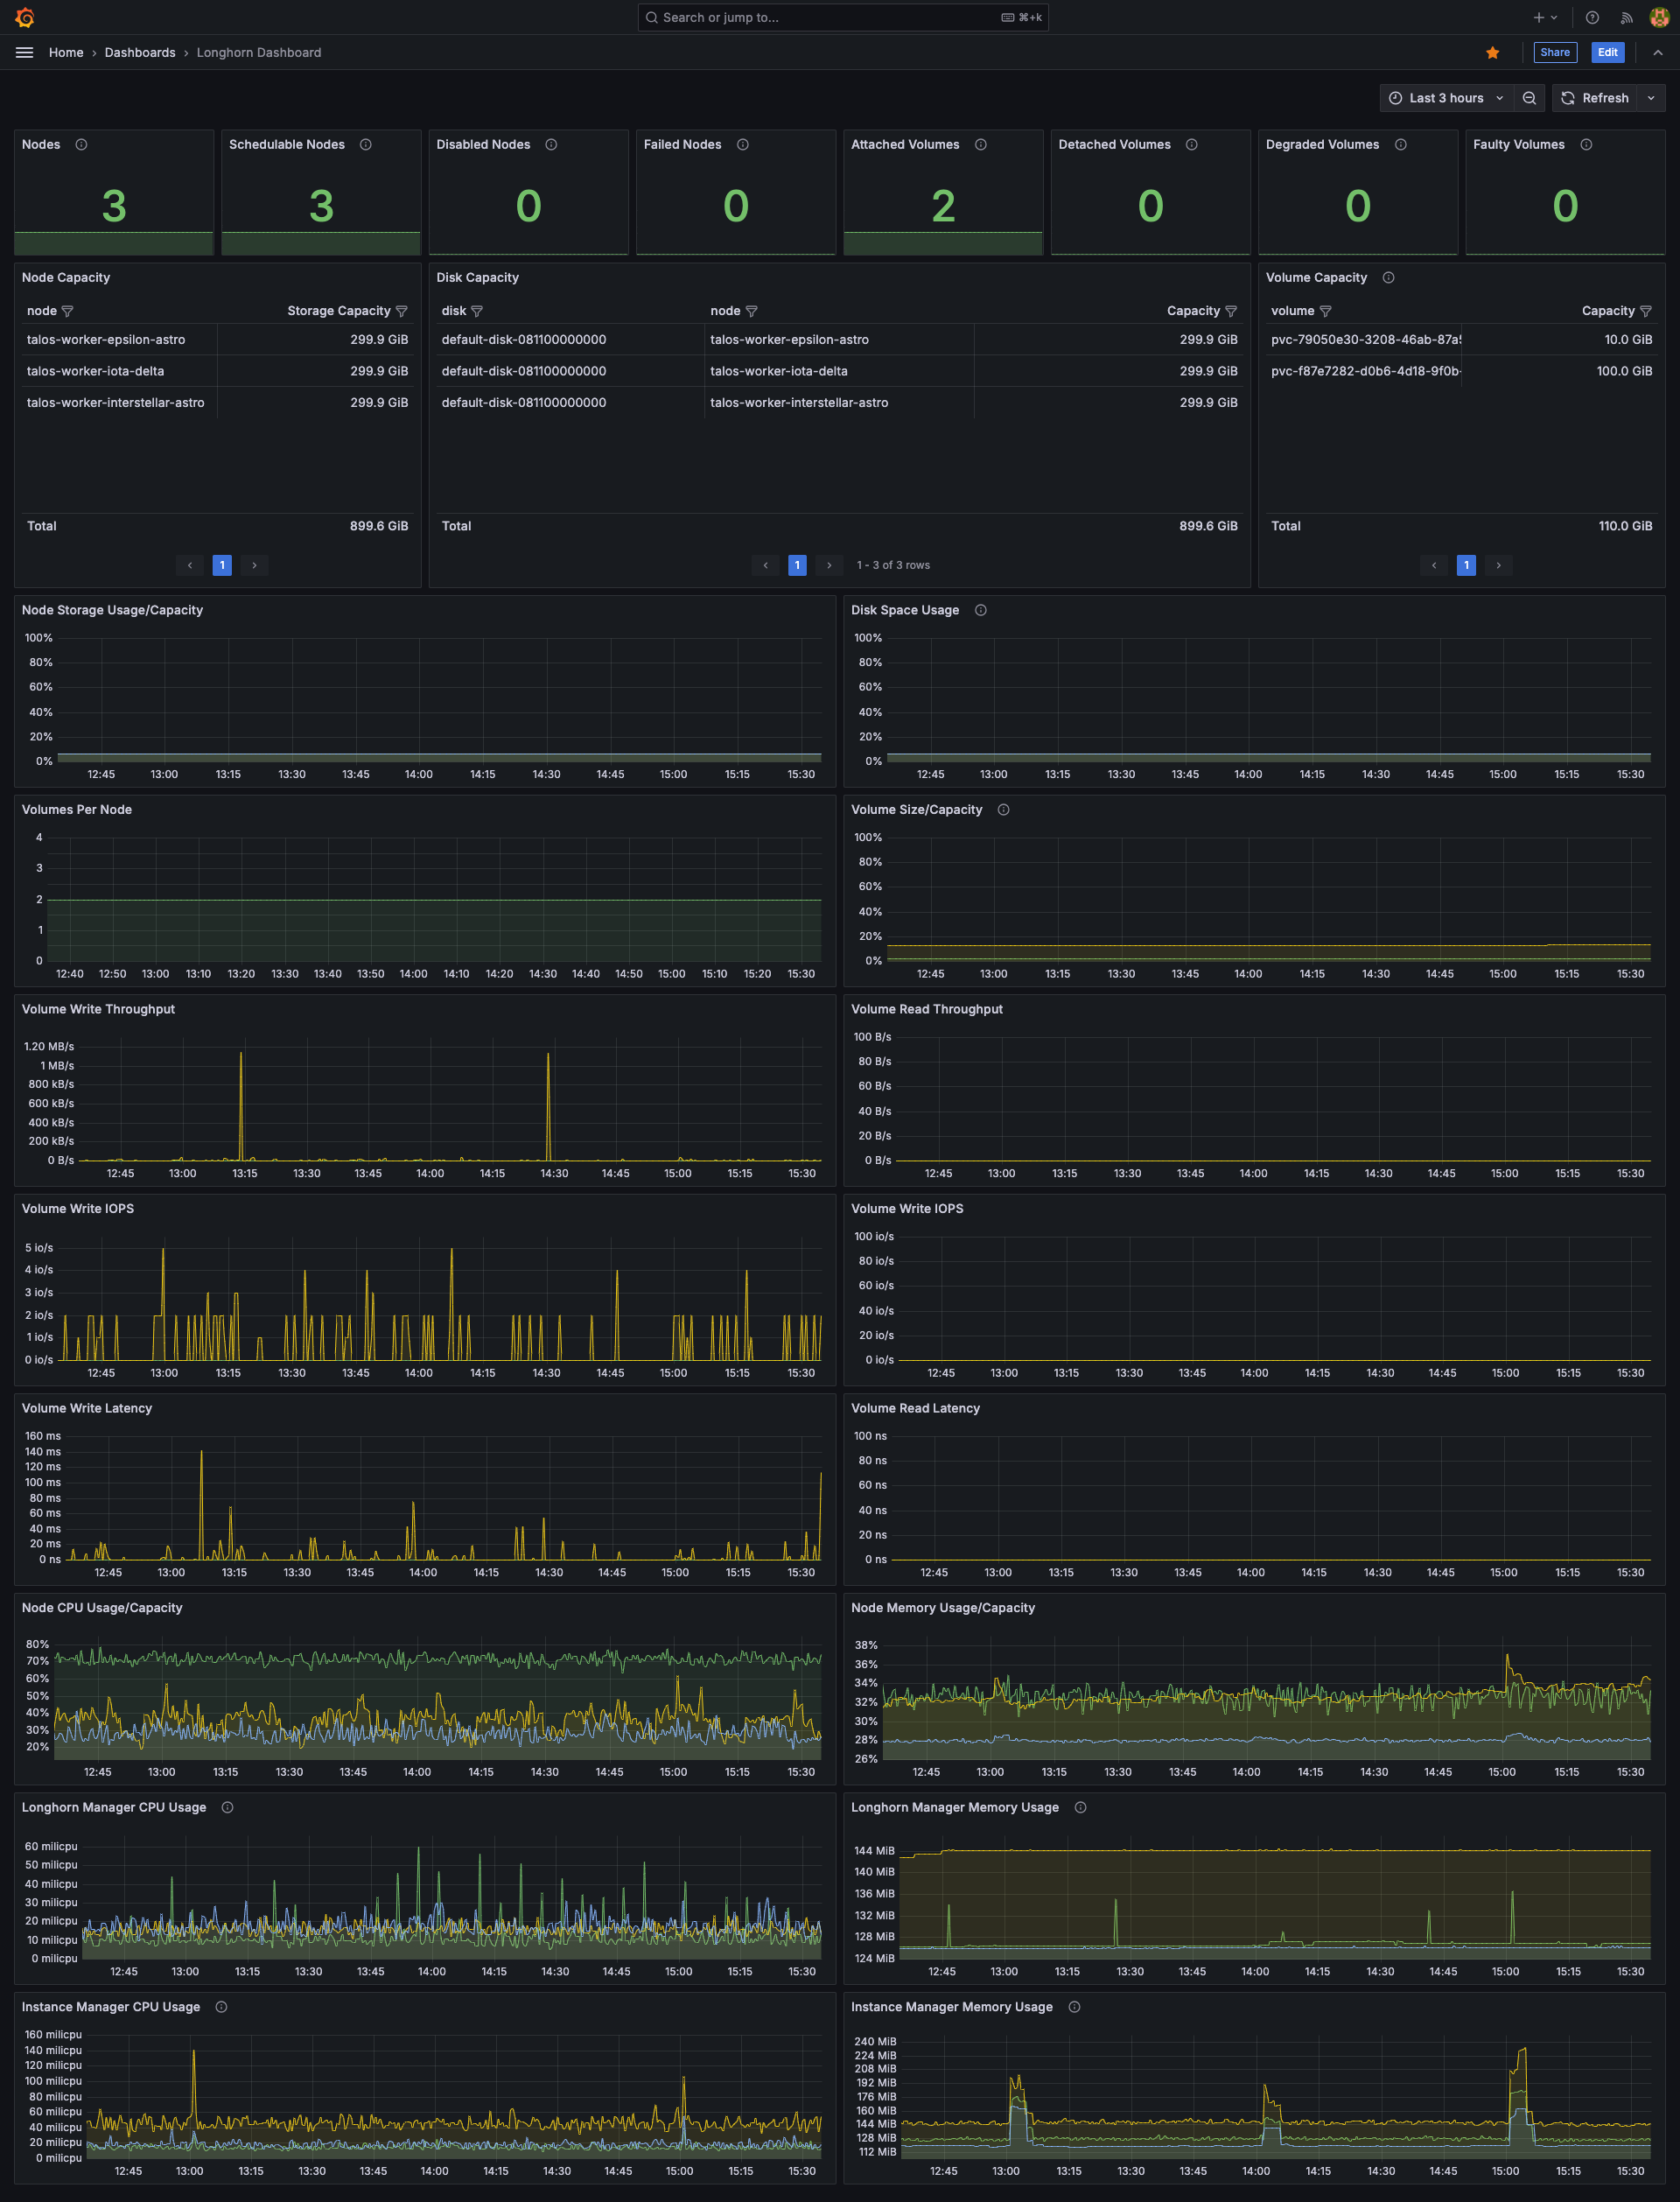
High-level view of Longhorn - useful for monitoring, alerting and troubleshooting.

Works on local, bare-metal or cloud provided clusters (e.g. k3s, kind, minikube, Talos Linux, EKS etc..)

github.com/adegoodyer/grafana-dashboards

Features

  • Node, disk and volume capacity
  • Node storage and disk space
  • Volumes per node and current capacity
  • Volume read/write throughput
  • Volume read/write iops
  • Volume read/write latency
  • Node CPU/memory
  • Longhorn Manager CPU/memory
  • Instance Manager CPU/memory

Contributing

  1. Fork the repository
  2. Create your feature branch (git checkout -b feature/amazing-feature)
  3. Commit your changes (git commit -m 'Add some amazing feature')
  4. Push to the branch (git push origin feature/amazing-feature)
  5. Open a Pull Request

License

This project is licensed under the MIT License - see the LICENSE file for details.

Support

https://www.buymeacoffee.com/adegoodyer

Get Dashboard
Download
Copy to Clipboard
Source Grafana.com

Used Metrics 24

  • longhorn_node_count_total

  • longhorn_node_status

  • longhorn_volume_state

  • longhorn_volume_robustness

  • longhorn_node_storage_capacity_bytes

  • longhorn_disk_capacity_bytes

  • longhorn_volume_capacity_bytes

  • longhorn_node_storage_usage_bytes

  • longhorn_disk_usage_bytes

  • longhorn_volume_actual_size_bytes

  • longhorn_volume_write_throughput

  • longhorn_volume_read_throughput

  • longhorn_volume_write_iops

  • longhorn_volume_read_iops

  • longhorn_volume_write_latency

  • longhorn_volume_read_latency

  • longhorn_node_cpu_usage_millicpu

  • longhorn_node_cpu_capacity_millicpu

  • longhorn_node_memory_usage_bytes

  • longhorn_node_memory_capacity_bytes

  • longhorn_manager_cpu_usage_millicpu

  • longhorn_manager_memory_usage_bytes

  • longhorn_instance_manager_cpu_usage_millicpu

  • longhorn_instance_manager_memory_usage_bytes