Loki2.0 Global Metrics 800,372800,372 4.5 (2 reviews)
Description
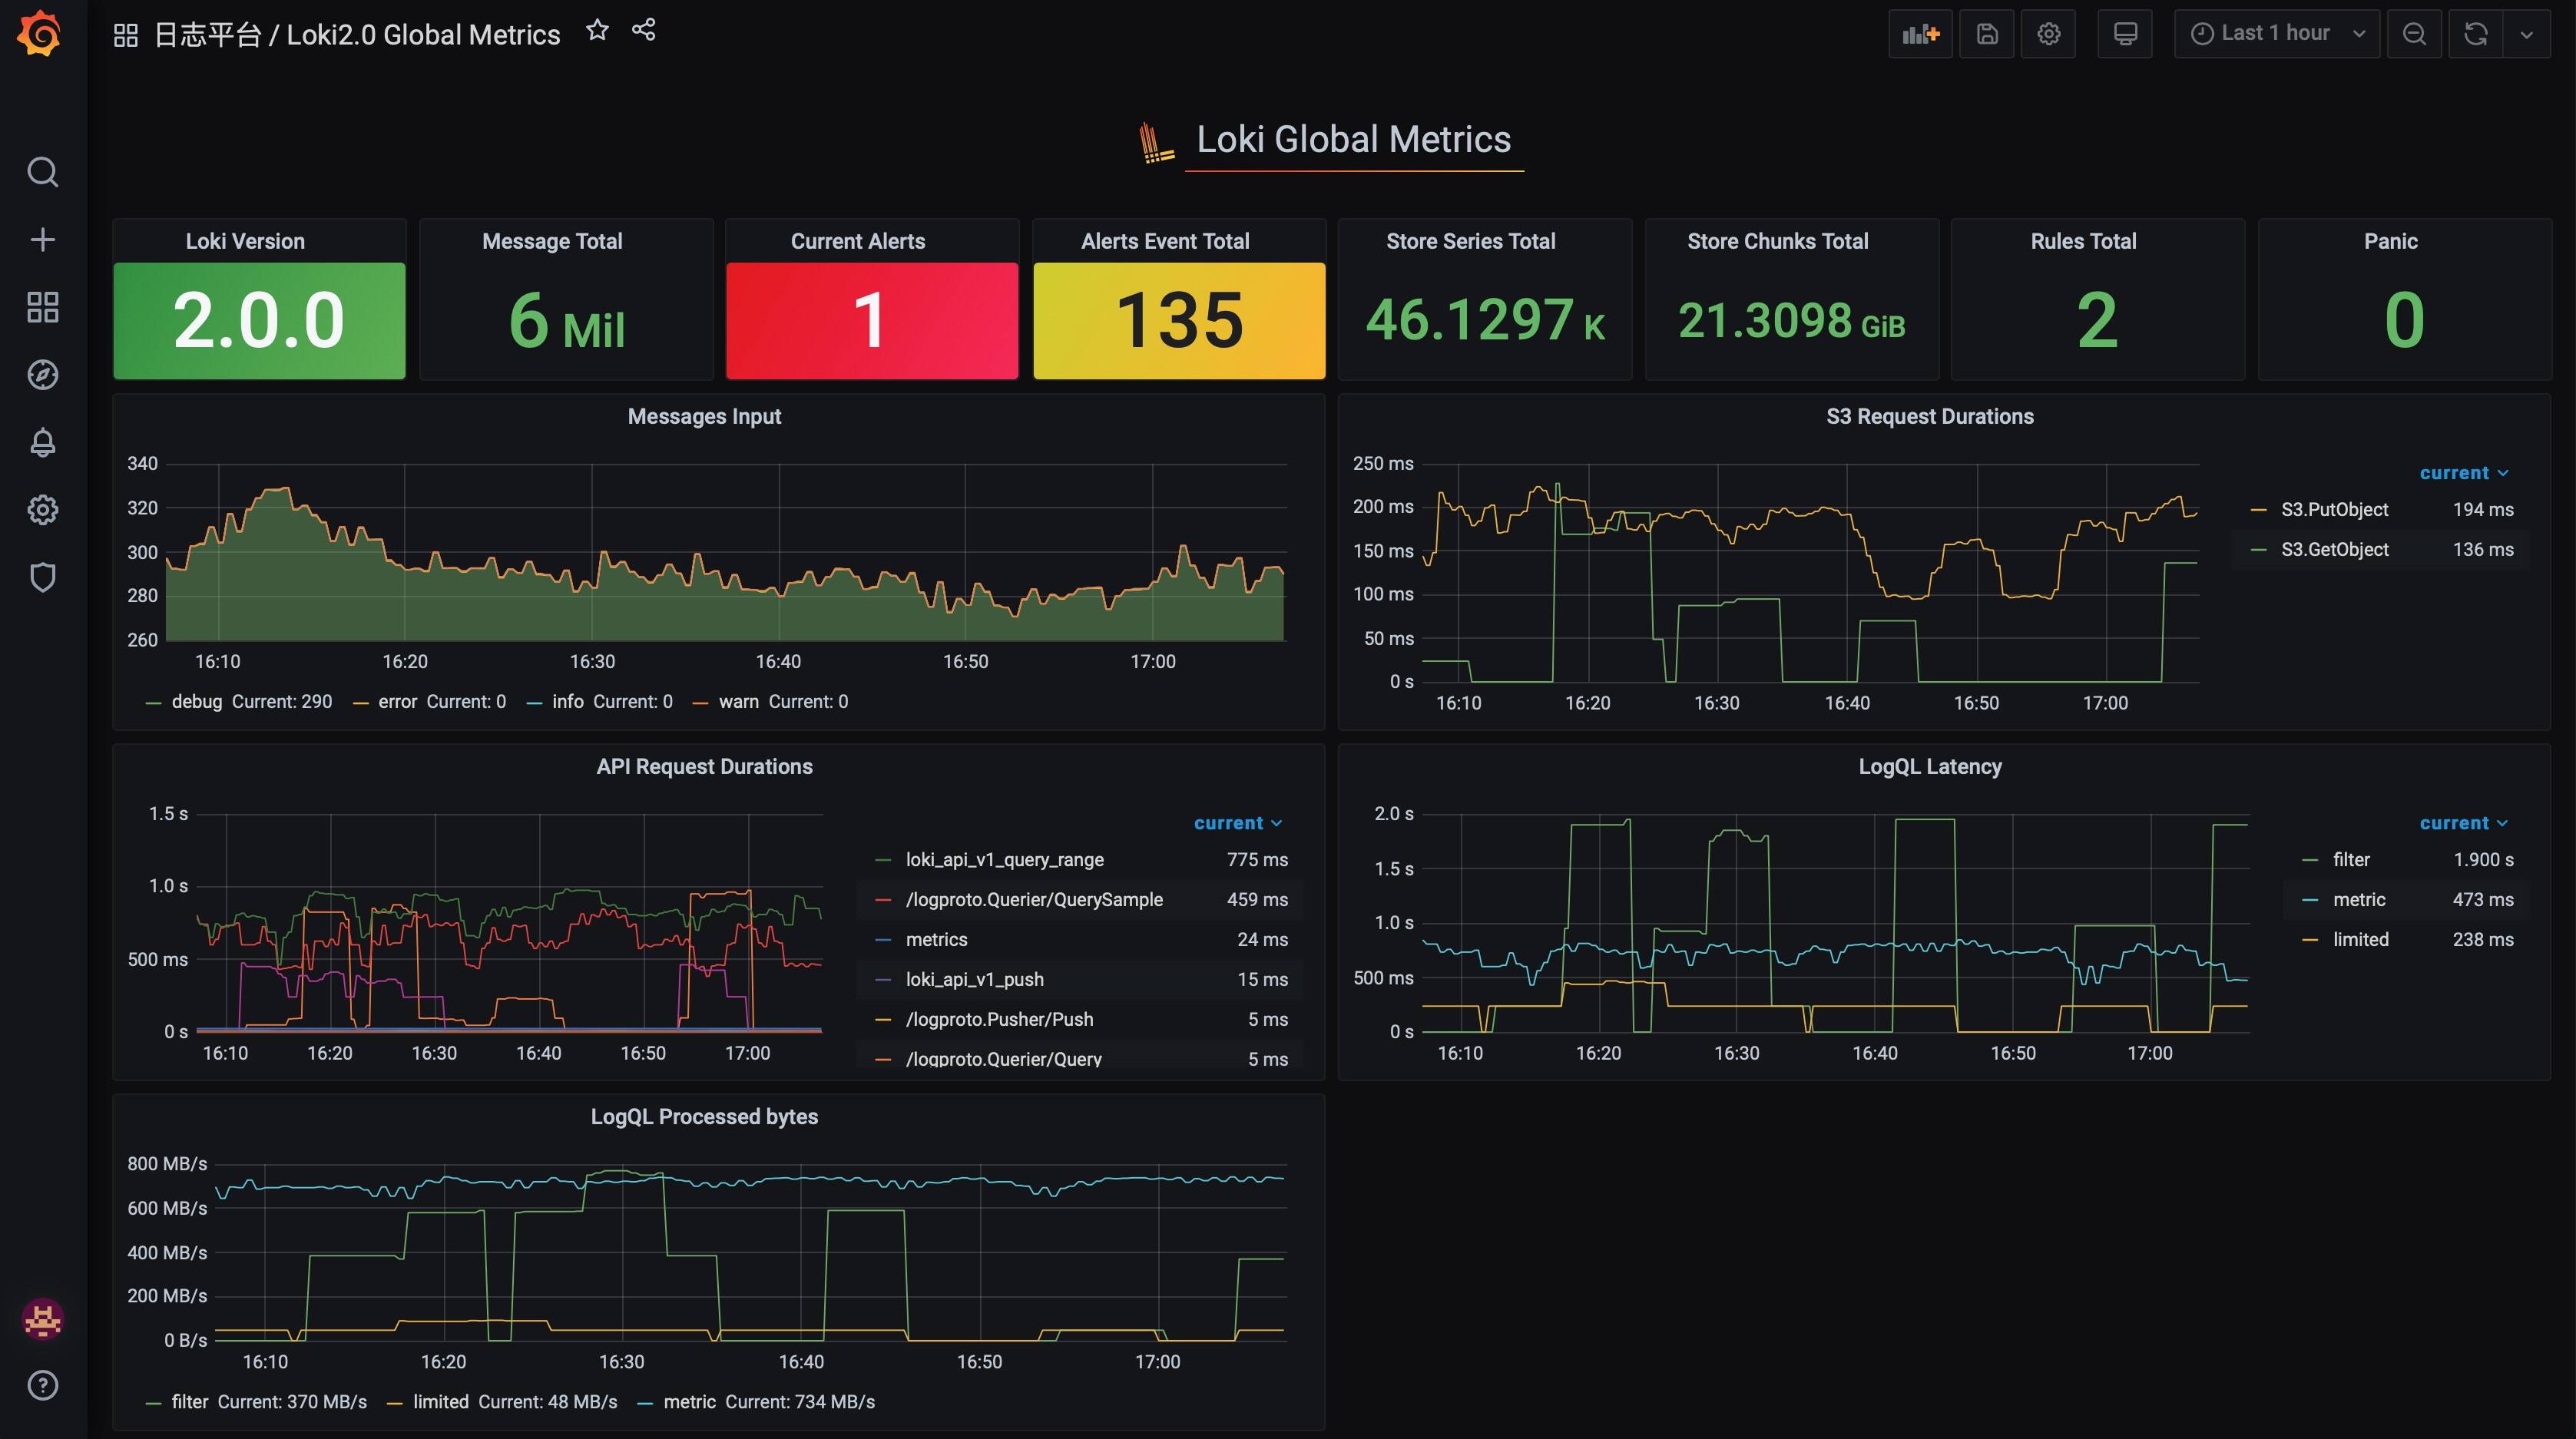
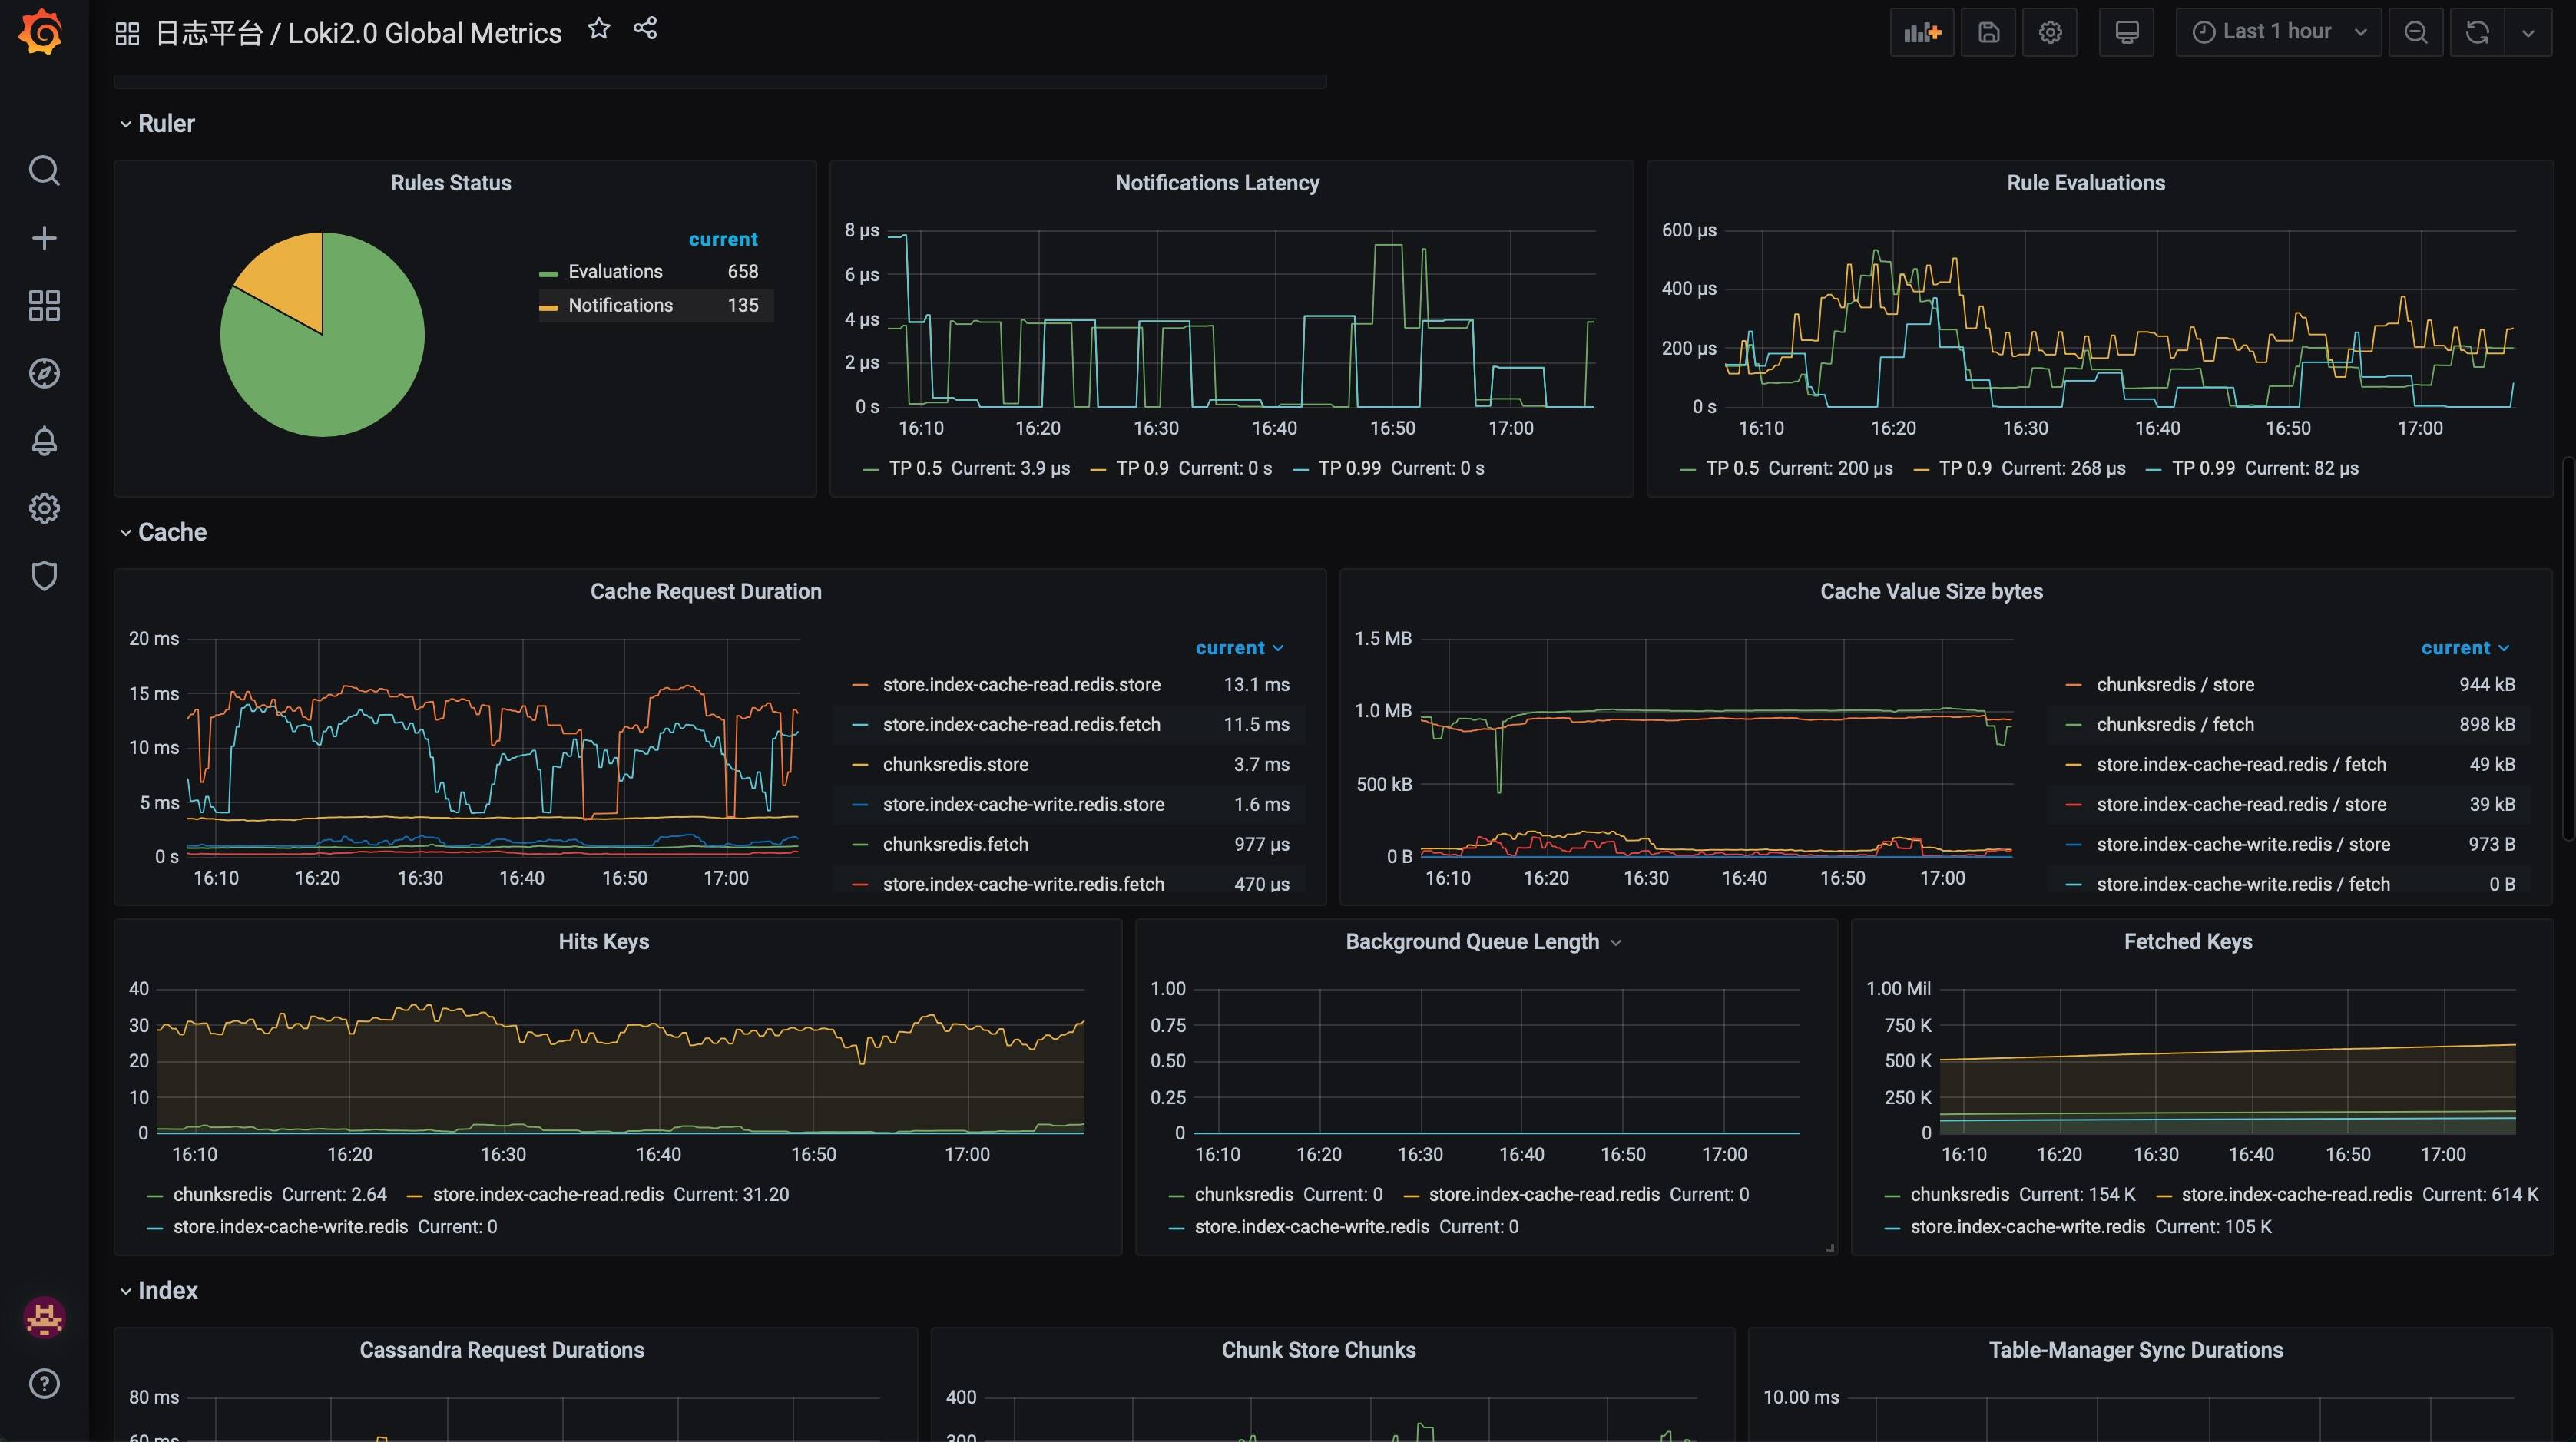
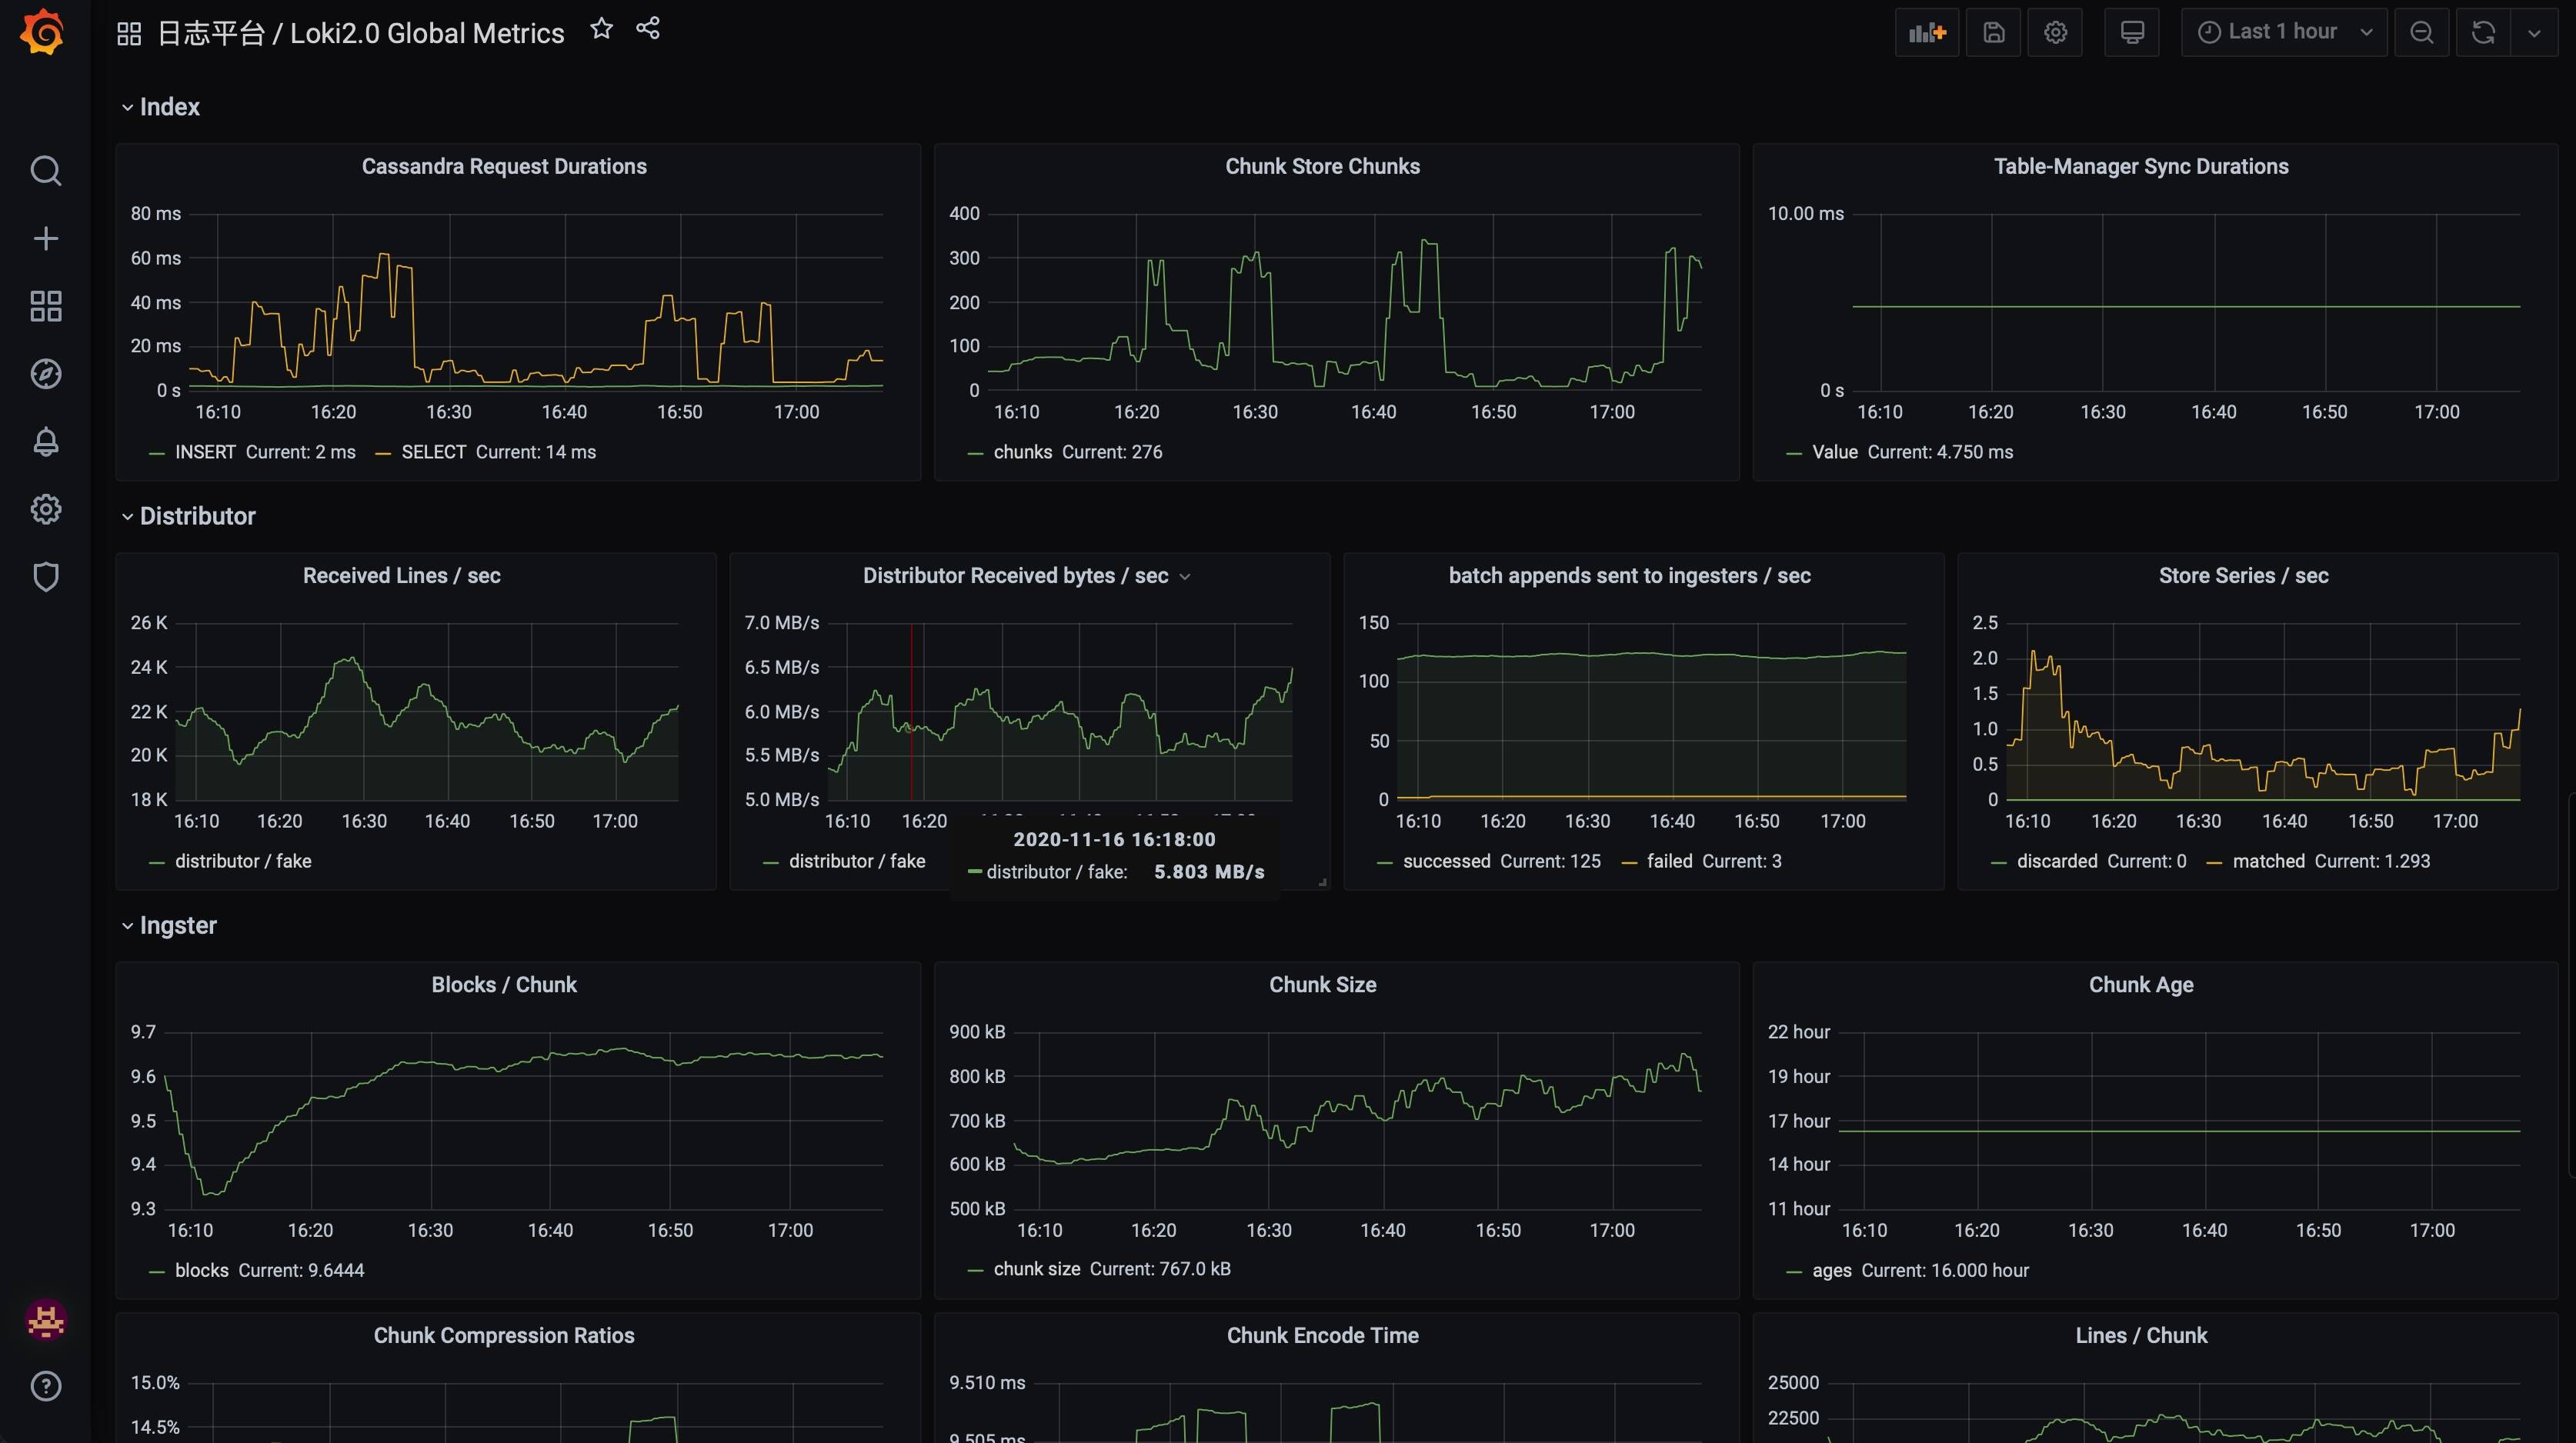
This dashboard provides a real-time overview of Loki's global health and performance by aggregating metrics across builds, stores, rules, and alerts. It highlights key operational signals such as loki_build_info, log_messages_total, and loki_panic_total, along with latency and throughput indicators like loki_request_duration_seconds_bucket and cortex_s3_request_duration_seconds_bucket to diagnose bottlenecks in log processing and storage. Users can quickly assess alert activity with current alerts and alerts event total, while store and rule metrics offer insight into data ingestion, indexing, and rule evaluation health.
Screenshots
Used Metrics 4040
cortex_cache_background_queue_length
cortex_cache_fetched_keys
cortex_cache_hits
cortex_cache_request_duration_seconds_bucket
cortex_cache_value_size_bytes_bucket
cortex_cassandra_request_duration_seconds_bucket
cortex_chunk_store_chunks_per_query_bucket
cortex_prometheus_notifications_alertmanagers_discovered
cortex_prometheus_notifications_latency_seconds
cortex_prometheus_notifications_sent_total
cortex_prometheus_rule_evaluation_duration_seconds
cortex_prometheus_rule_evaluations_total
cortex_prometheus_rule_group_rules
cortex_s3_request_duration_seconds_bucket
cortex_table_manager_sync_duration_seconds_bucket
log_messages_total
loki_build_info
loki_distributor_bytes_received_total
loki_distributor_ingester_append_failures_total
loki_distributor_ingester_appends_total
loki_distributor_lines_received_total
loki_ingester_blocks_per_chunk_bucket
loki_ingester_chunk_age_seconds_bucket
loki_ingester_chunk_compression_ratio_bucket
loki_ingester_chunk_encode_time_seconds_bucket
loki_ingester_chunk_entries_bucket
loki_ingester_chunk_size_bytes_bucket
loki_ingester_chunk_stored_bytes_total
loki_ingester_chunks_created_total
loki_ingester_chunks_flushed_total
loki_ingester_chunks_stored_total
loki_ingester_memory_chunks
loki_ingester_memory_streams
loki_ingester_streams_created_total
loki_ingester_streams_removed_total
loki_logql_querystats_bytes_processed_per_seconds_bucket
loki_logql_querystats_latency_seconds_bucket
loki_panic_total
loki_request_duration_seconds_bucket
loki_store_series_total