Loki v2 Events Dashboard for Kubernetes 46,52246,522
Description
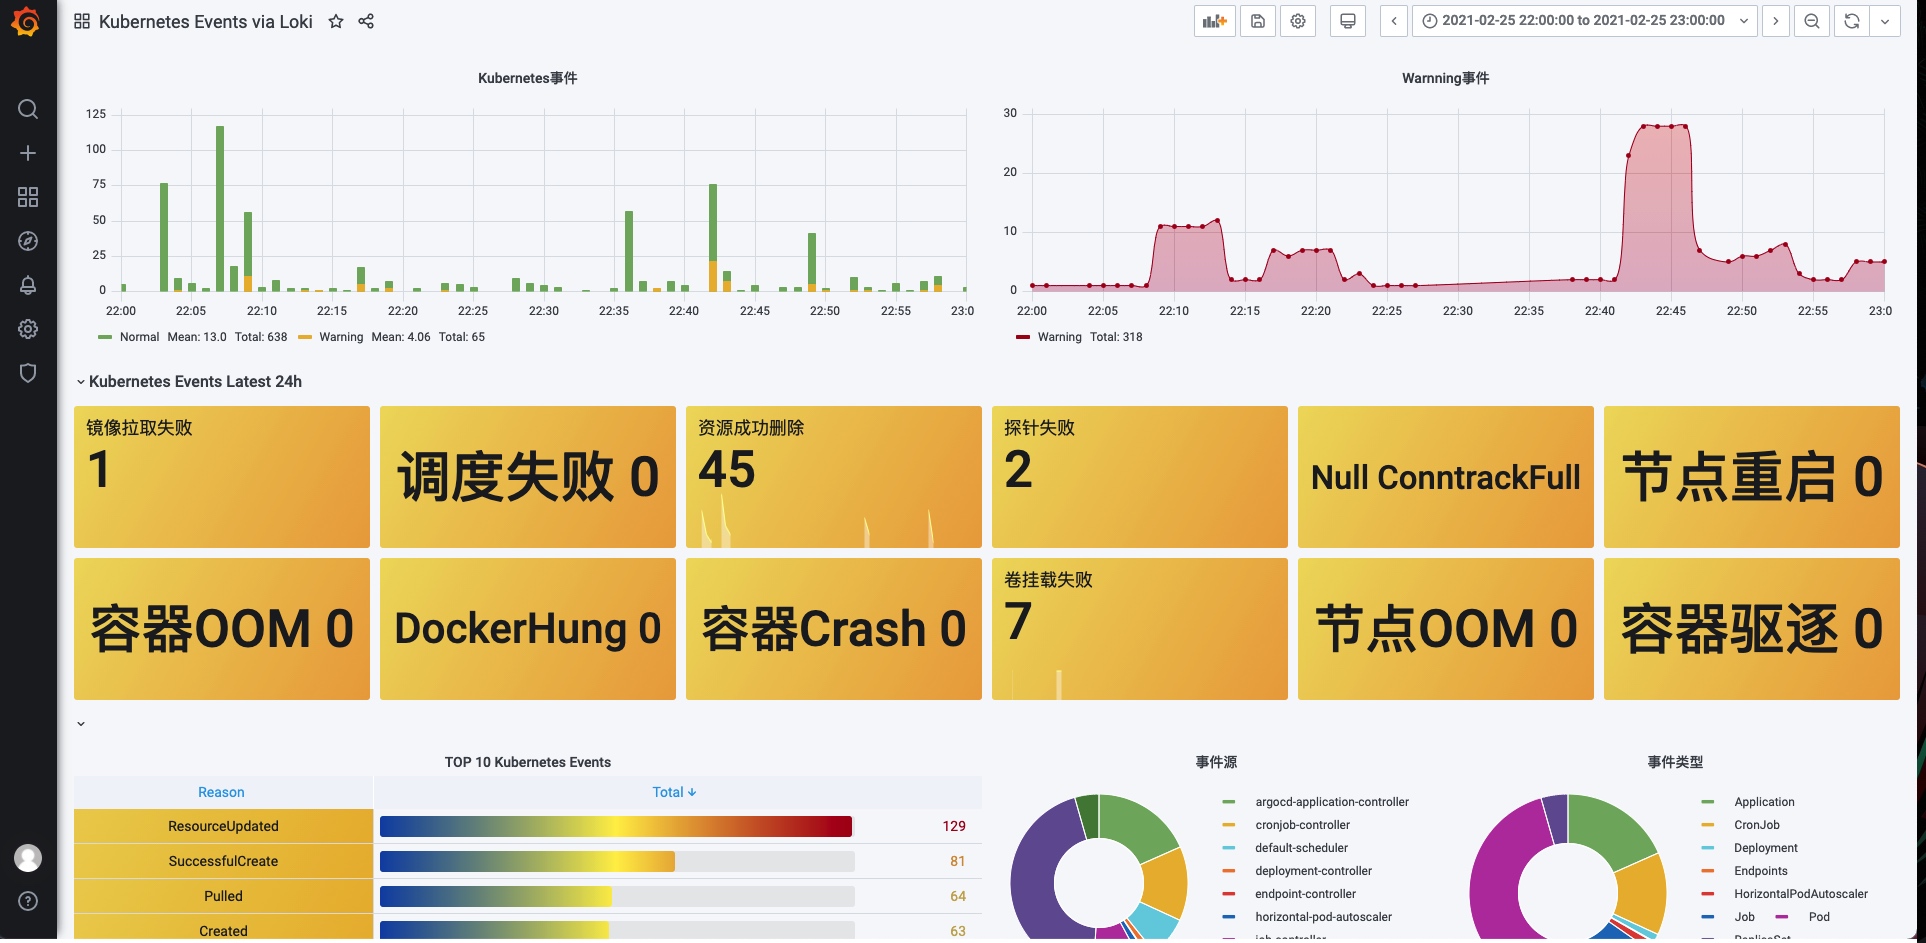
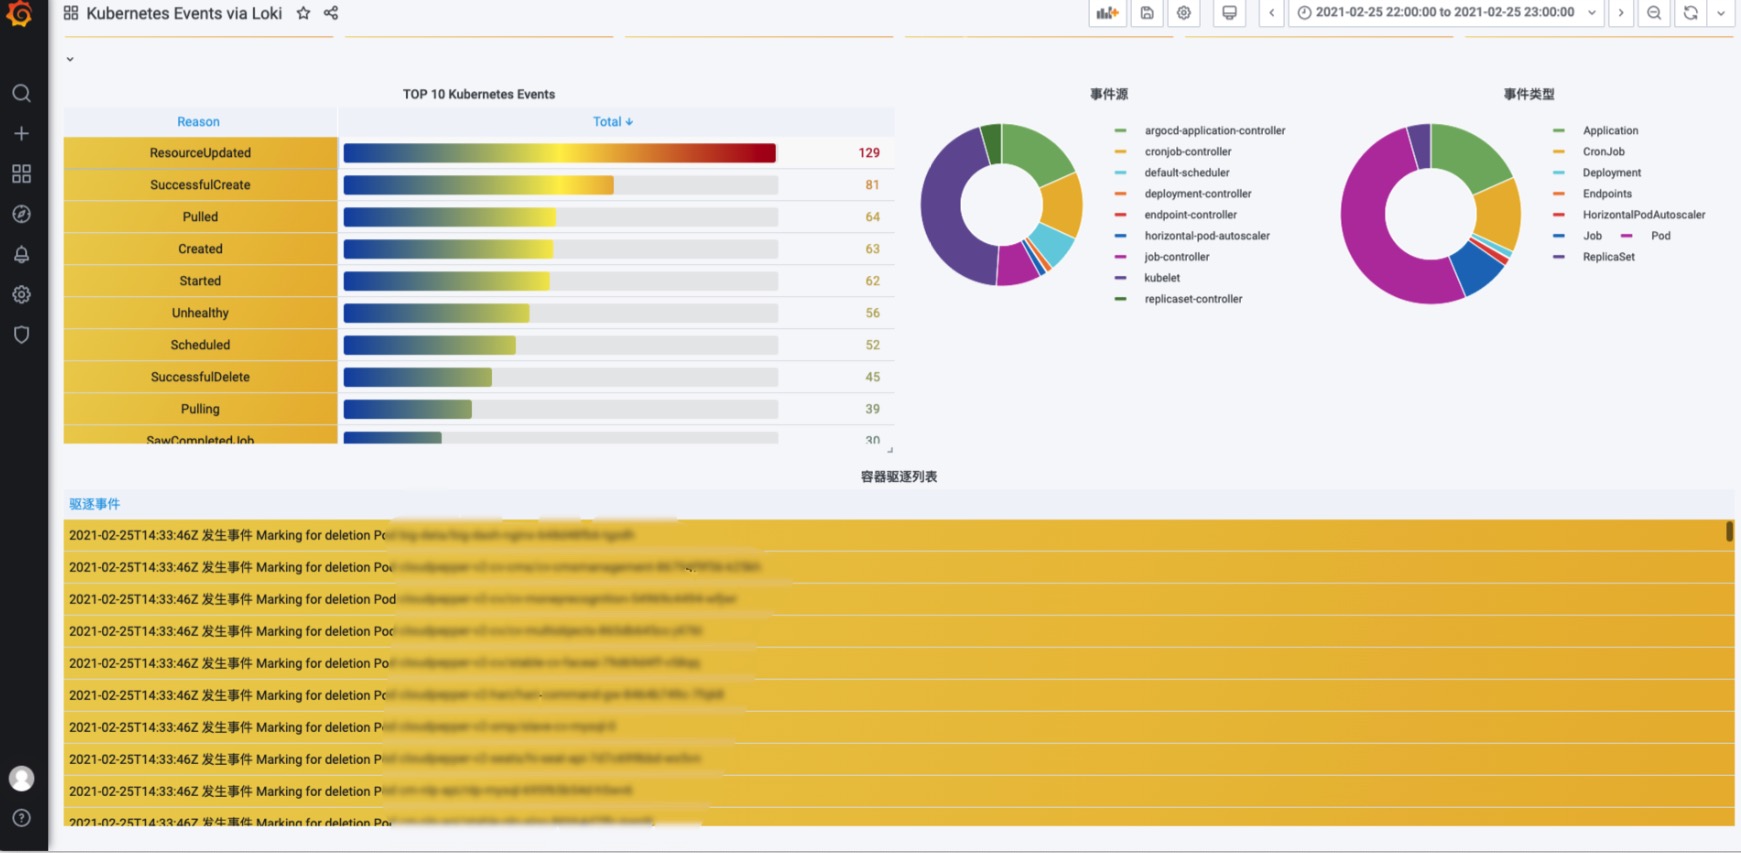
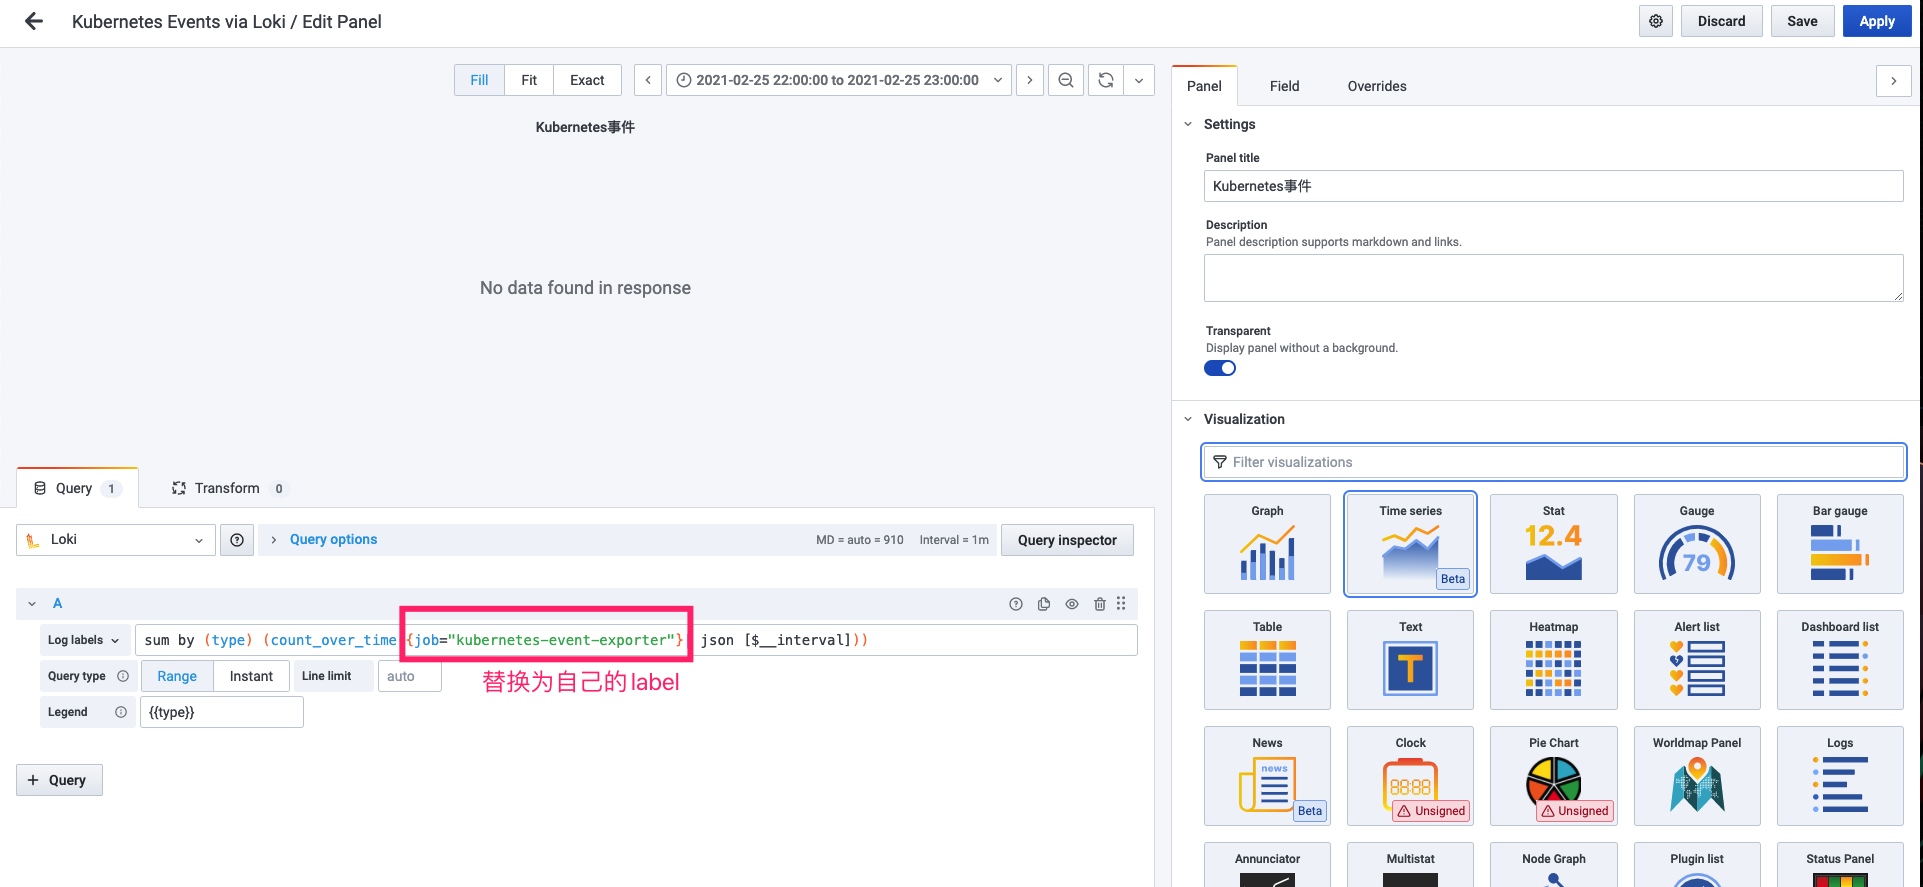
Monitors and visualizes Kubernetes event activity from Loki, highlighting frequently occurring and critical events across the cluster. Key features include a focus on event types and sources, with prioritized views like the TOP 10 Kubernetes Events and breakdowns by type, reason, and container lifecycle events; it surfaces common failures such as ImagePullBackOff and FailedScheduling, helping operators quickly identify and triage issues. The dashboard also integrates error signaling with __error__ and supports contextual drill-downs into specific event categories like Warning vs Error.
Screenshots
Used Metrics 2828
BackOff
ConntrackFull
DockerHung
Error:
Failed
FailedMount
FailedScheduling
ImagePullBackOff
Killing
Marking
OOMKilling
Pod
Rebooted
SuccessfulDelete
SystemOOM
TaintManagerEviction
Warning
__error__
deletion
failed
for
json
line_format
liveness
probe
reason
topk
type