Loki & Promtail 845,654845,654 4.0 (2 reviews)
9/18/2019
9/18/2019
1
>=6.3.4
Prometheus
Description
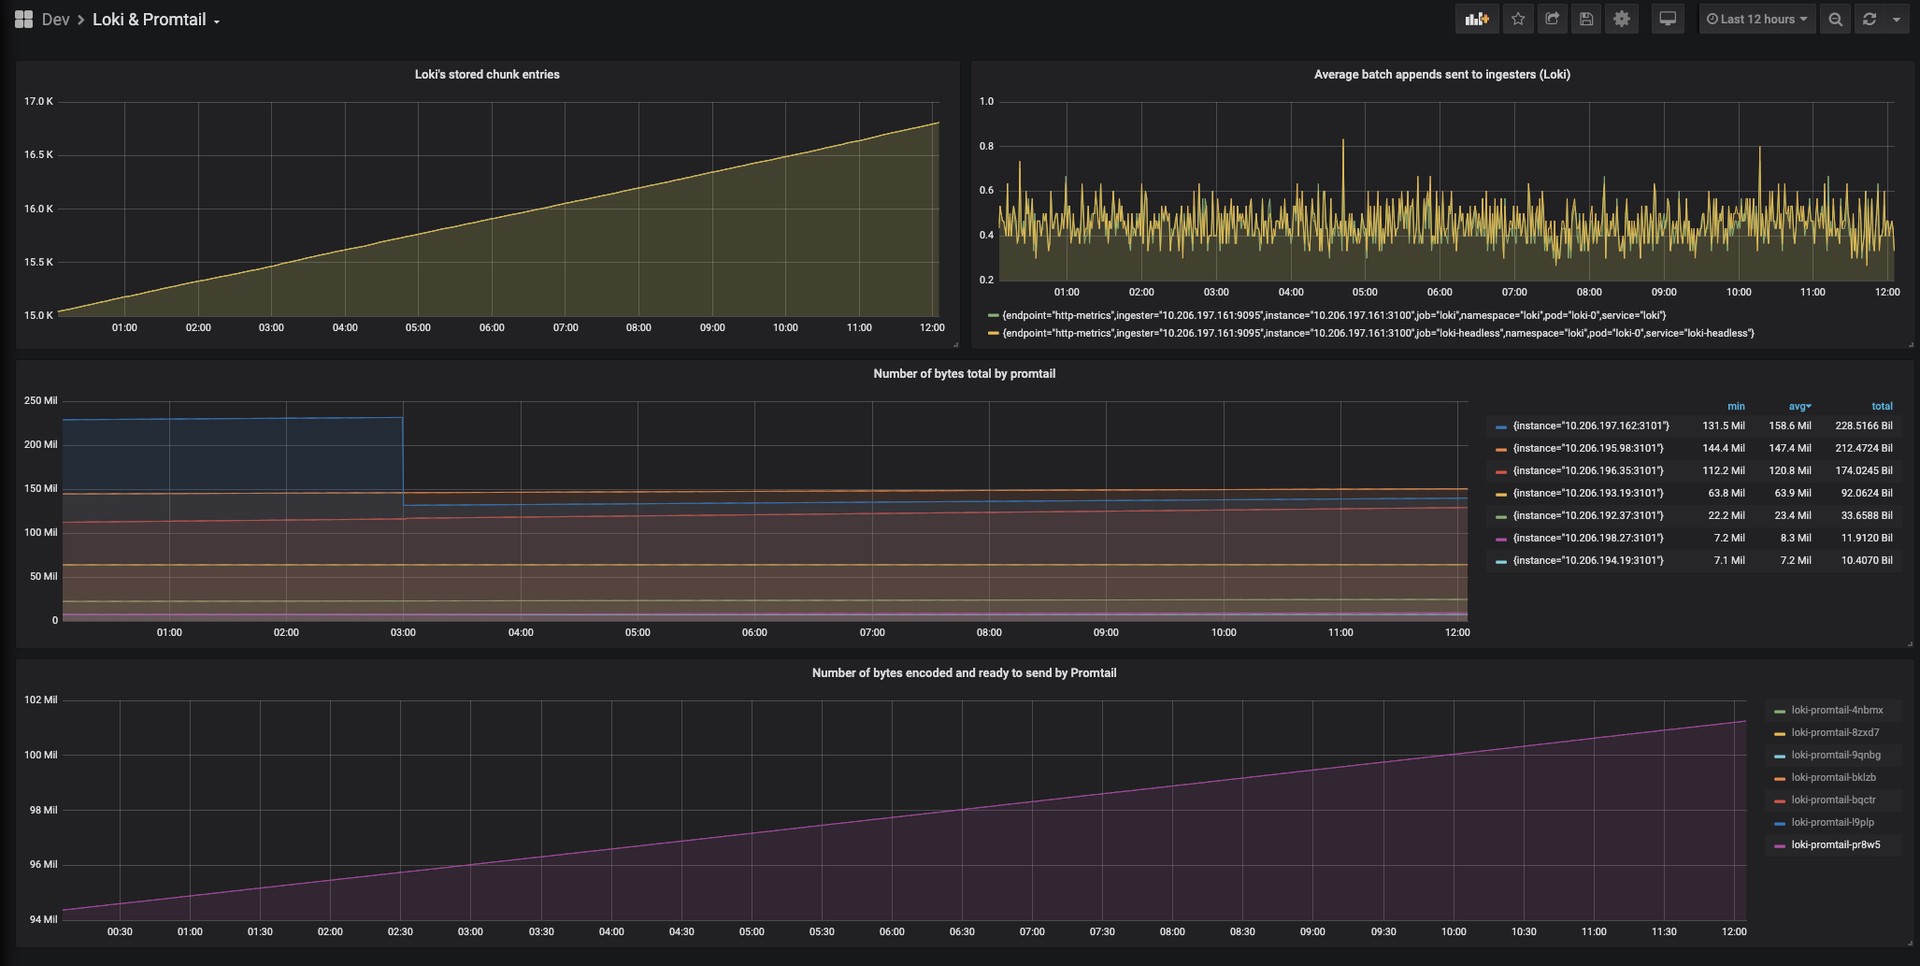
This dashboard monitors Loki data ingestion and Promtail performance, focusing on how much data is stored and how efficiently it’s processed and transmitted. It highlights chunk accounting, batch append throughput, and per-file vs encoded bytes to surface bottlenecks: for example, loki_ingester_chunk_entries_count tracks stored chunks, loki_distributor_ingester_appends_total shows average batch appends to ingesters, and promtail_encoded_bytes_total alongside promtail_file_bytes_total reveals encoding efficiency and payload size trends.
Screenshots
Used Metrics 44
loki_distributor_ingester_appends_total
loki_ingester_chunk_entries_count
promtail_encoded_bytes_total
promtail_file_bytes_total
Get Dashboard✕
Download
Copy to Clipboard