Loki Metrics Dashboard 68,09968,099
Description
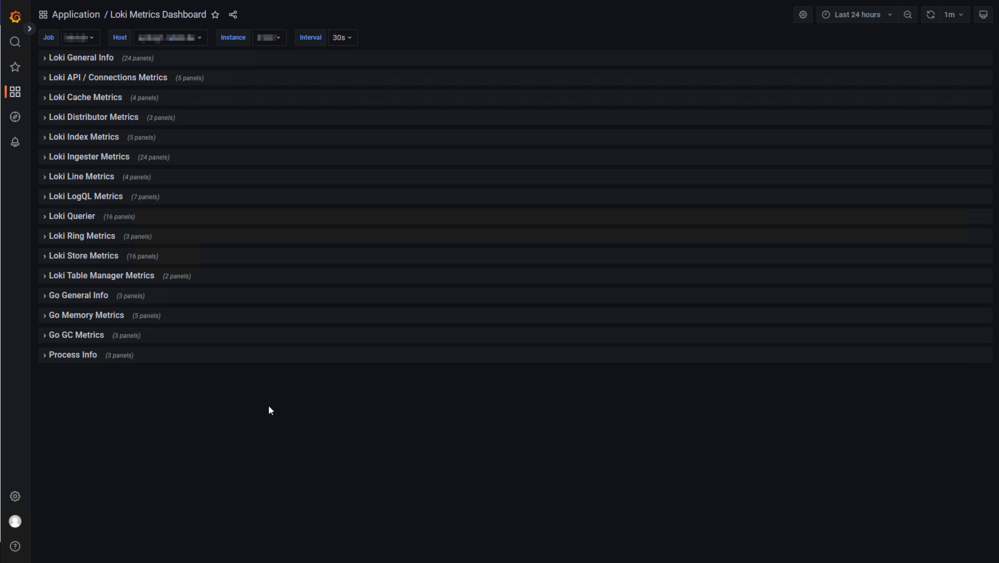
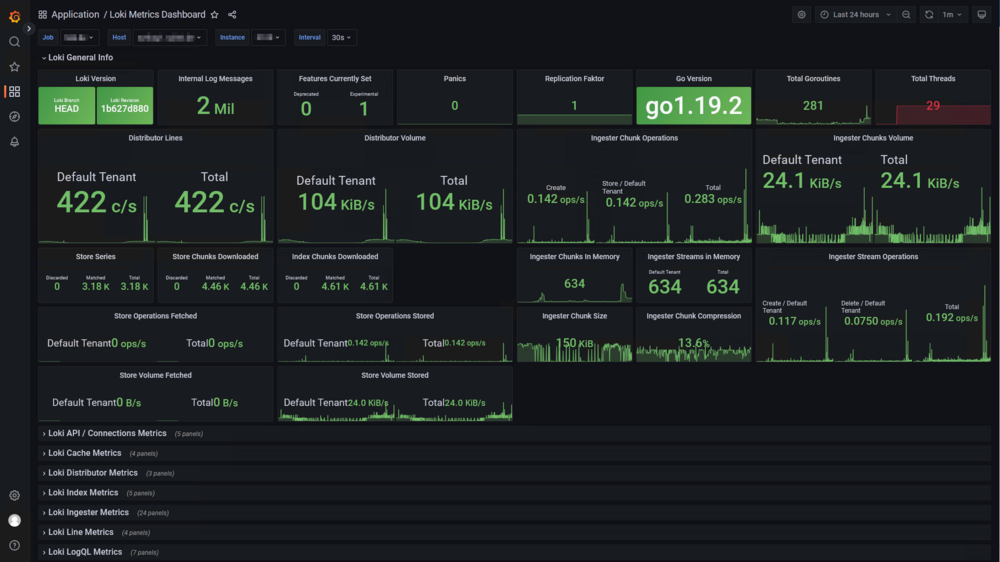
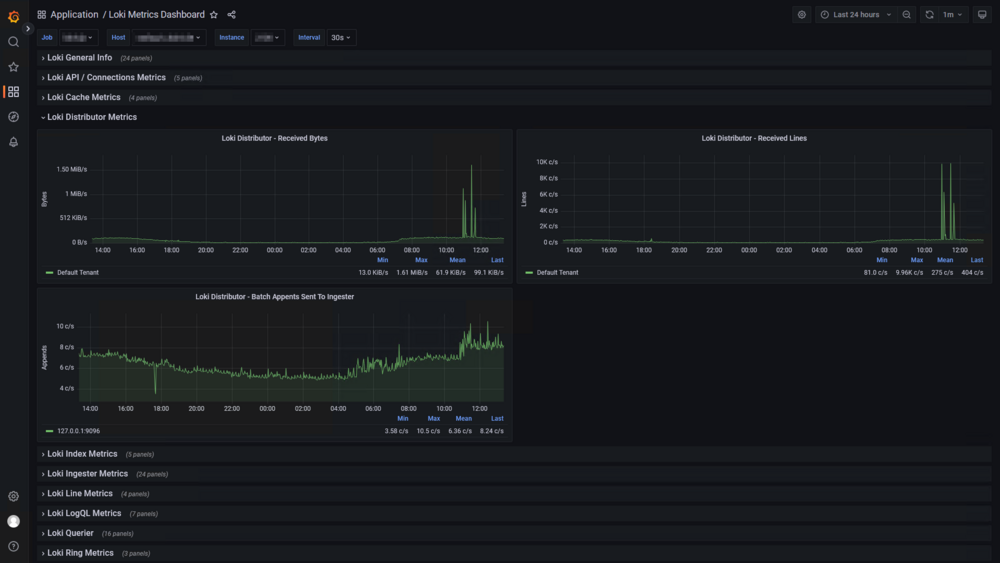
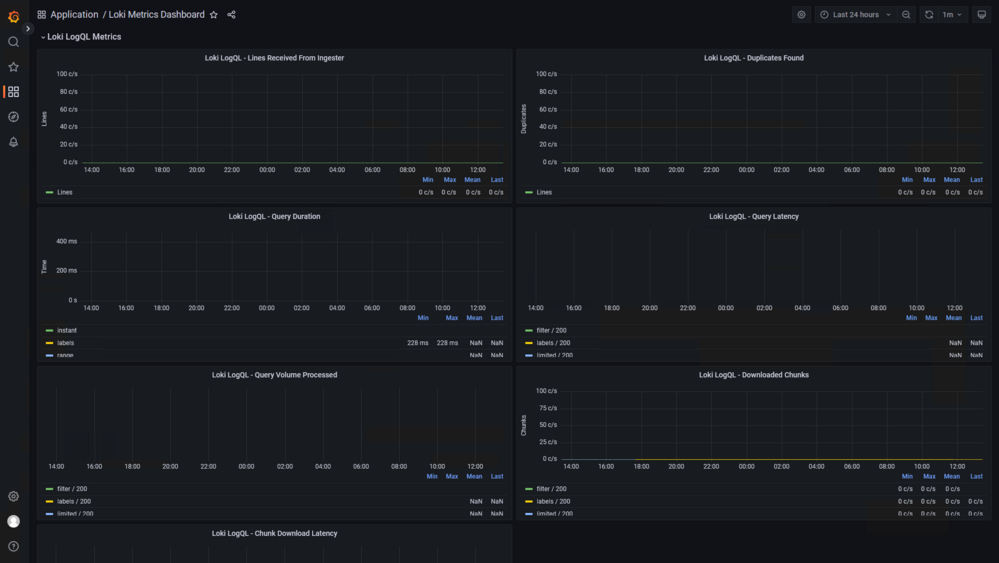
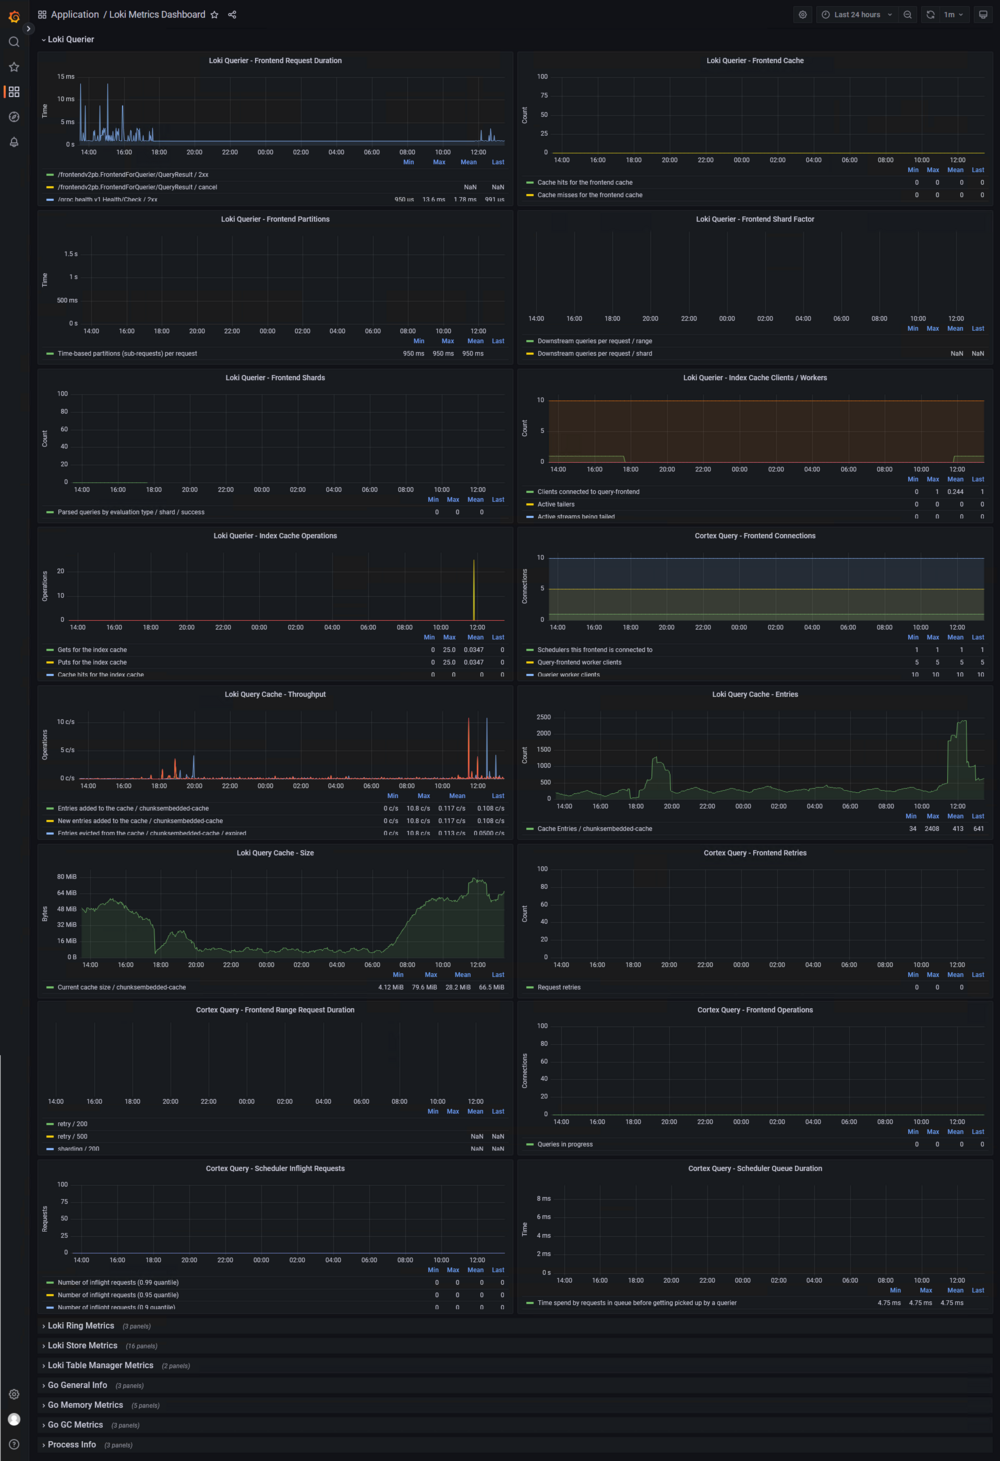
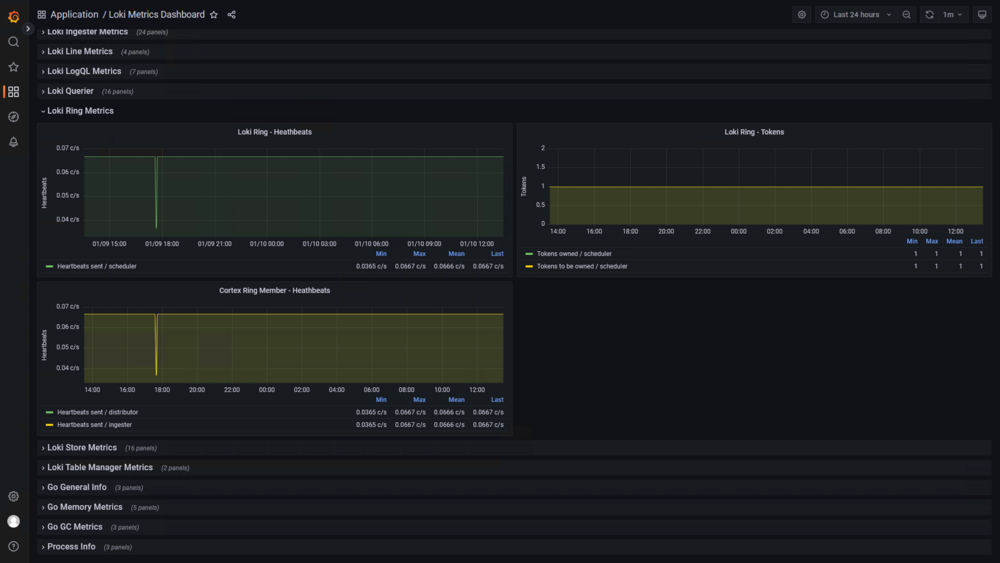
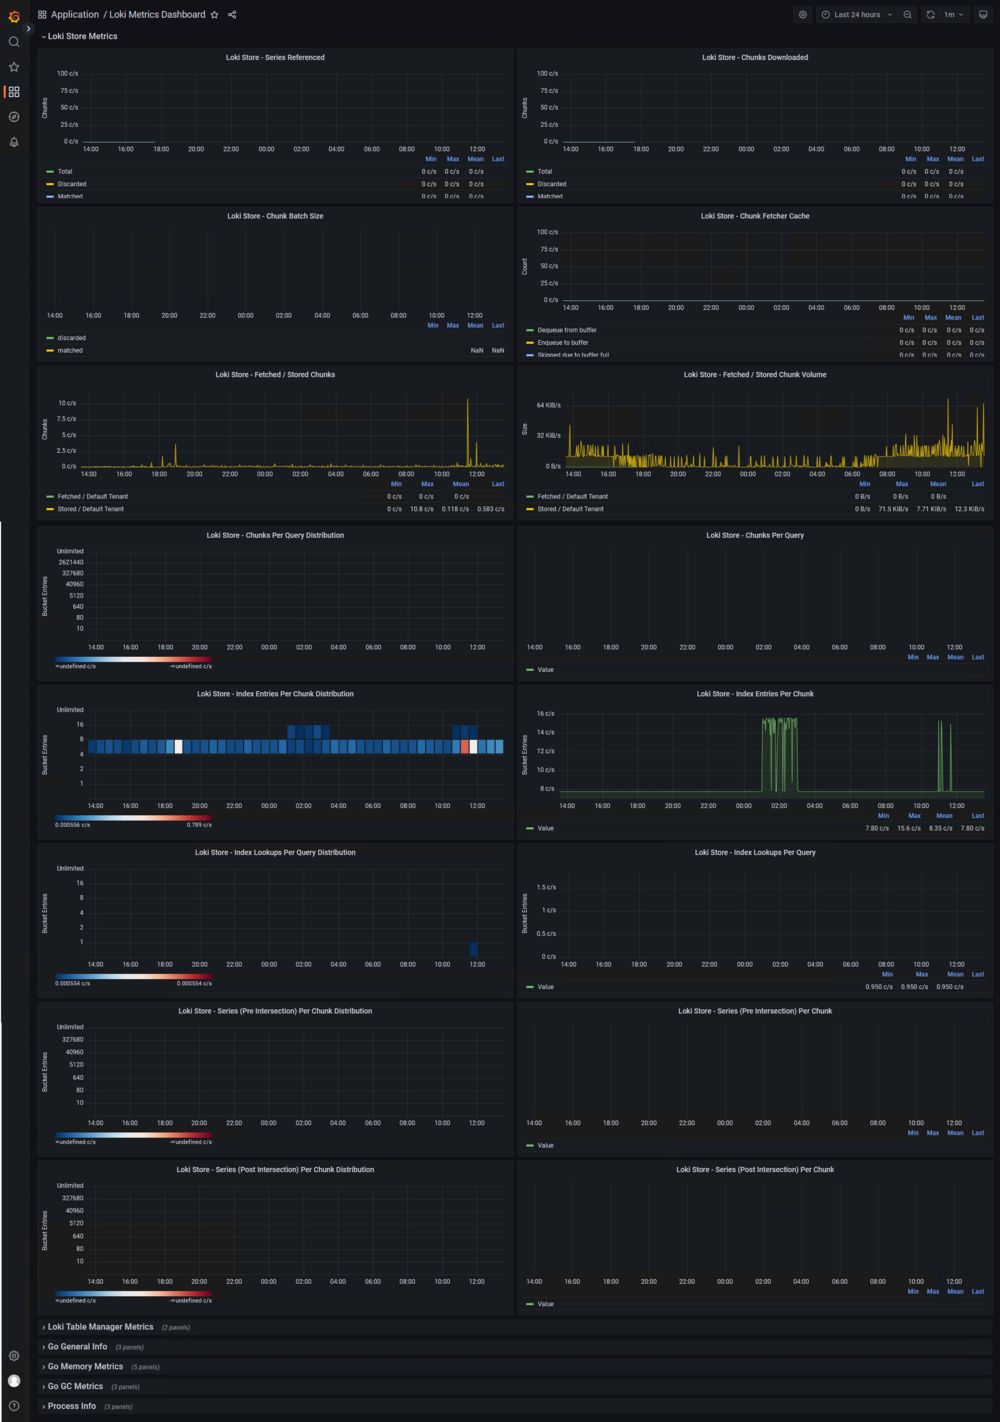
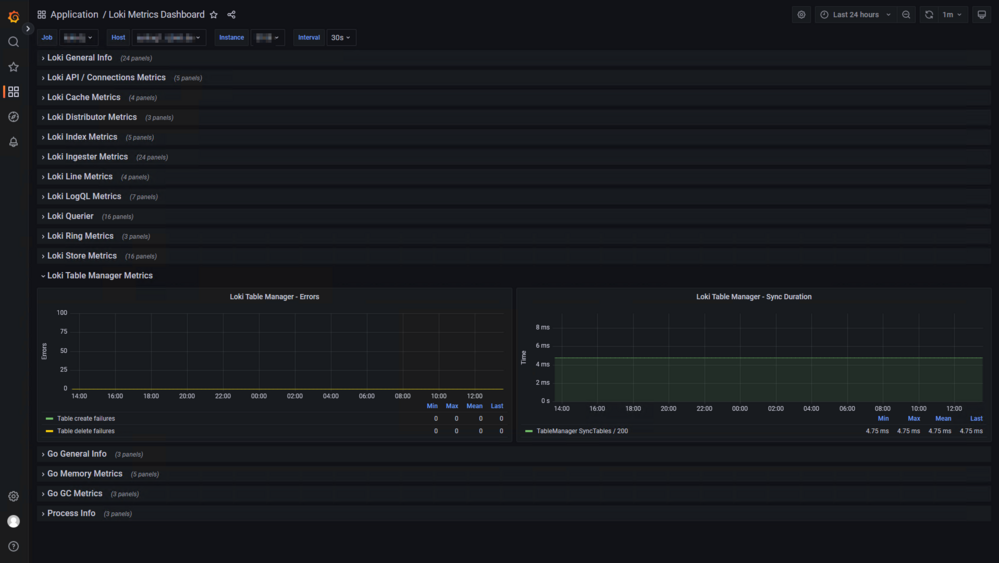
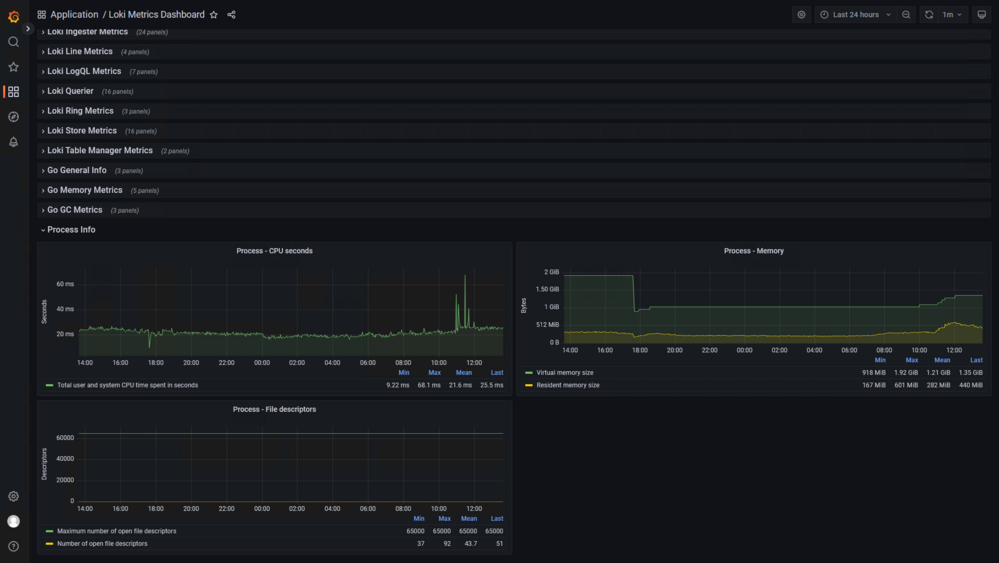
This dashboard monitors Loki deployment health and performance by aggregating build, runtime, and operational metrics. It highlights version and build info with loki_build_info and runtime availability, through metrics like go_info, go_goroutines, and go_threads, alongside operational throughput and reliability using loki_distributor_lines_received_total, loki_internal_log_messages_total, and loki_panic_total to surface issues in log processing, replication, and chunk handling. Overall, it provides a concise view of version, feature usage, panics, replication, and chunk/stream statistics across distributor, ingester, and store components.
Screenshots
Used Metrics 2727
deprecated_flags_inuse_total
-
go_goroutines
-
go_info
-
go_threads
loki_build_info
loki_chunk_store_fetched_chunk_bytes_total
loki_chunk_store_fetched_chunks_total
loki_chunk_store_stored_chunk_bytes_total
loki_chunk_store_stored_chunks_total
loki_distributor_bytes_received_total
loki_distributor_lines_received_total
loki_distributor_replication_factor
loki_experimental_features_in_use_total
loki_index_chunk_refs_total
loki_ingester_chunk_compression_ratio_bucket
loki_ingester_chunk_size_bytes_bucket
loki_ingester_chunk_stored_bytes_total
loki_ingester_chunks_created_total
loki_ingester_chunks_stored_total
loki_ingester_memory_chunks
loki_ingester_memory_streams
loki_ingester_streams_created_total
loki_ingester_streams_removed_total
loki_internal_log_messages_total
loki_panic_total
loki_store_chunks_downloaded_total
loki_store_series_total