Loki Dashboard 290,092290,092
10/15/2020
10/15/2020
1
>=7.0.3
LokiPrometheus
Description
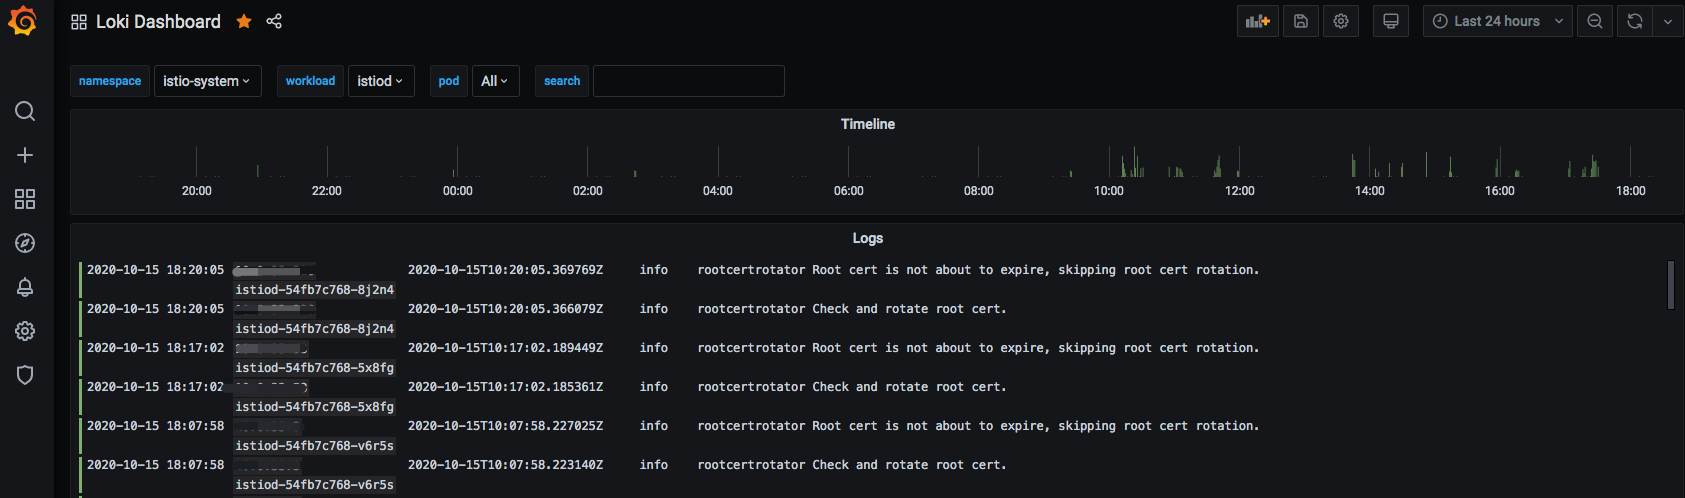
This Grafana setup visualizes log data ingested by Loki, focusing on temporal trends and detailed log content. It highlights search latency and log throughput alongside a timeline view to correlate events over time, enabling quick identification of spikes and anomalies. Notable metrics include search, log throughput, and latency to assess query performance and log ingestion efficiency.
Screenshots
Used Metrics 11
search
Get Dashboard✕
Download
Copy to Clipboard