Loki-Canary 389,463389,463
Description
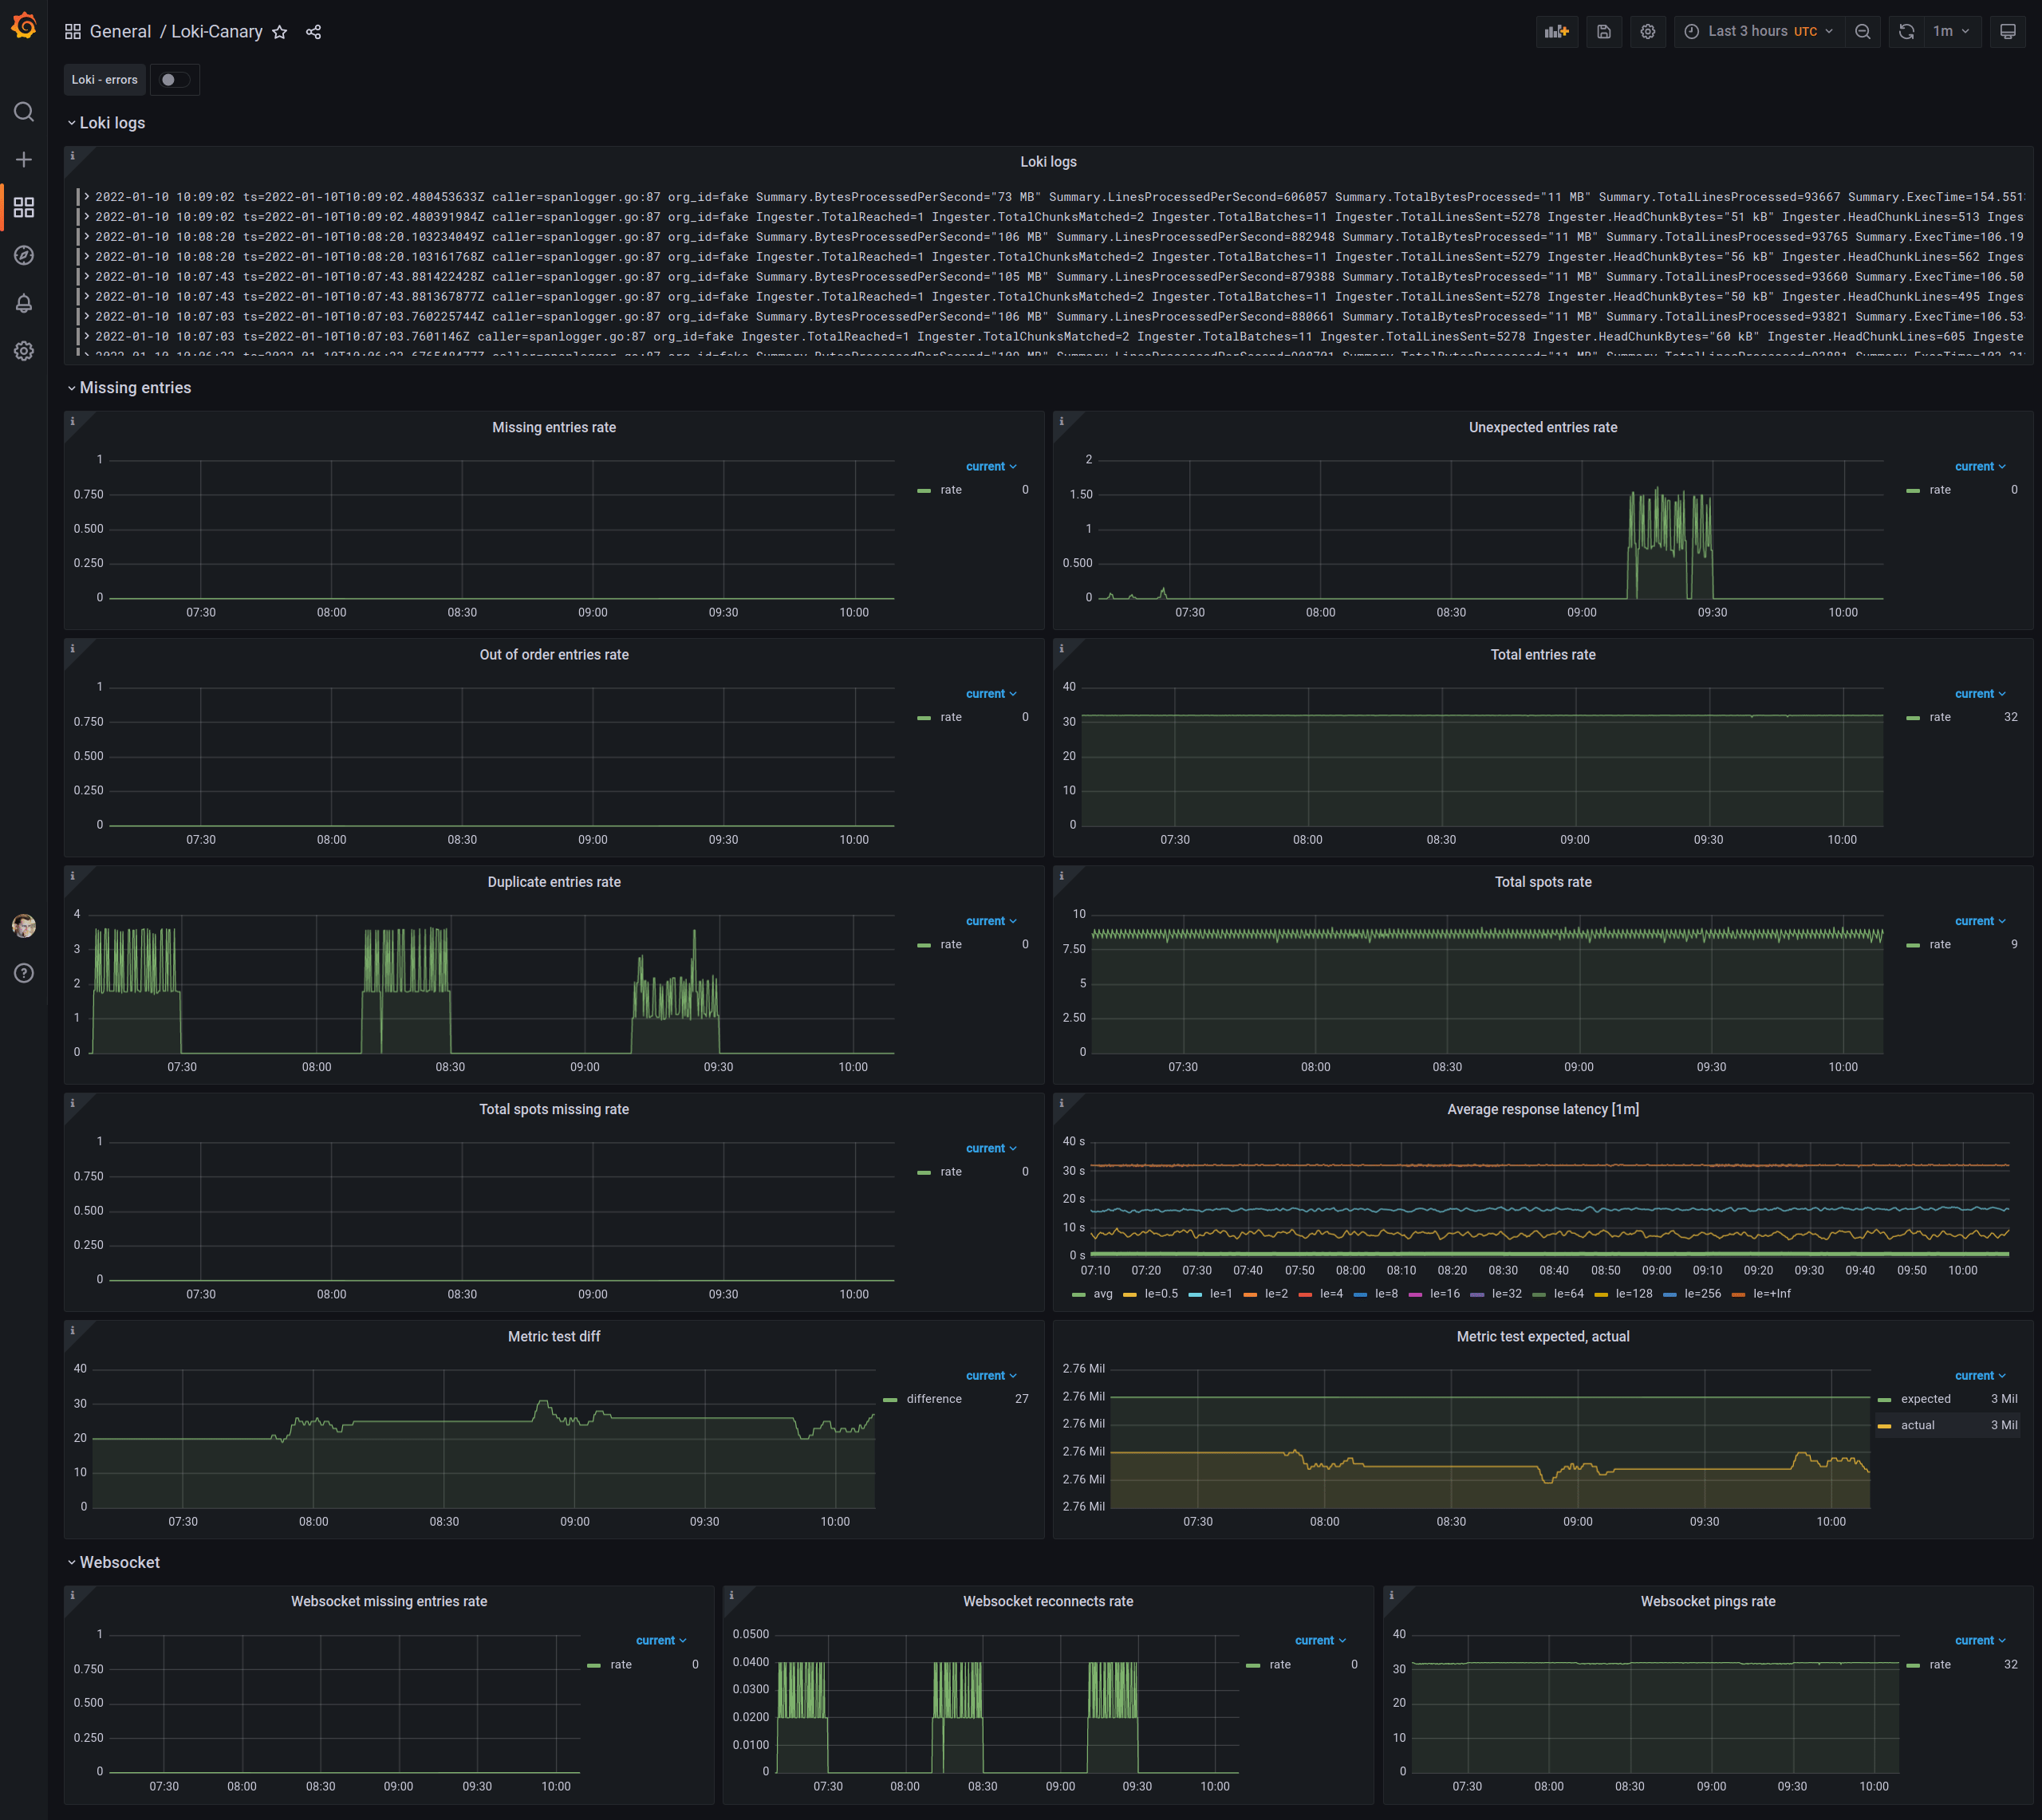
This Grafana dashboard monitors Loki-based canary health and log integrity, focusing on entry quality and system responsiveness. It surfaces rates of missing, unexpected, out-of-order, and duplicate entries via metrics like loki_canary_missing_entries_total, loki_canary_unexpected_entries_total, and loki_canary_out_of_order_entries_total, while also tracking overall loki_canary_entries_total and latency through loki_canary_response_latency_seconds_sum to alert on performance regressions and data gaps.
Screenshots
Used Metrics 1717
info
loki_canary_duplicate_entries_total
loki_canary_entries_total
loki_canary_metric_test_actual
loki_canary_metric_test_expected
loki_canary_missing_entries_total
loki_canary_out_of_order_entries_total
loki_canary_response_latency_seconds_bucket
loki_canary_response_latency_seconds_count
loki_canary_response_latency_seconds_sum
loki_canary_spot_check_entries_total
loki_canary_spot_check_missing_entries_total
loki_canary_unexpected_entries_total
loki_canary_websocket_missing_entries_total
loki_canary_ws_pings_total
loki_canary_ws_reconnects_total
ppppppppppppppppppppppppppppppppppppppppppppppppppppppppppppppppppppppppppppppp