Logging Dashboard 712,520712,520
Description
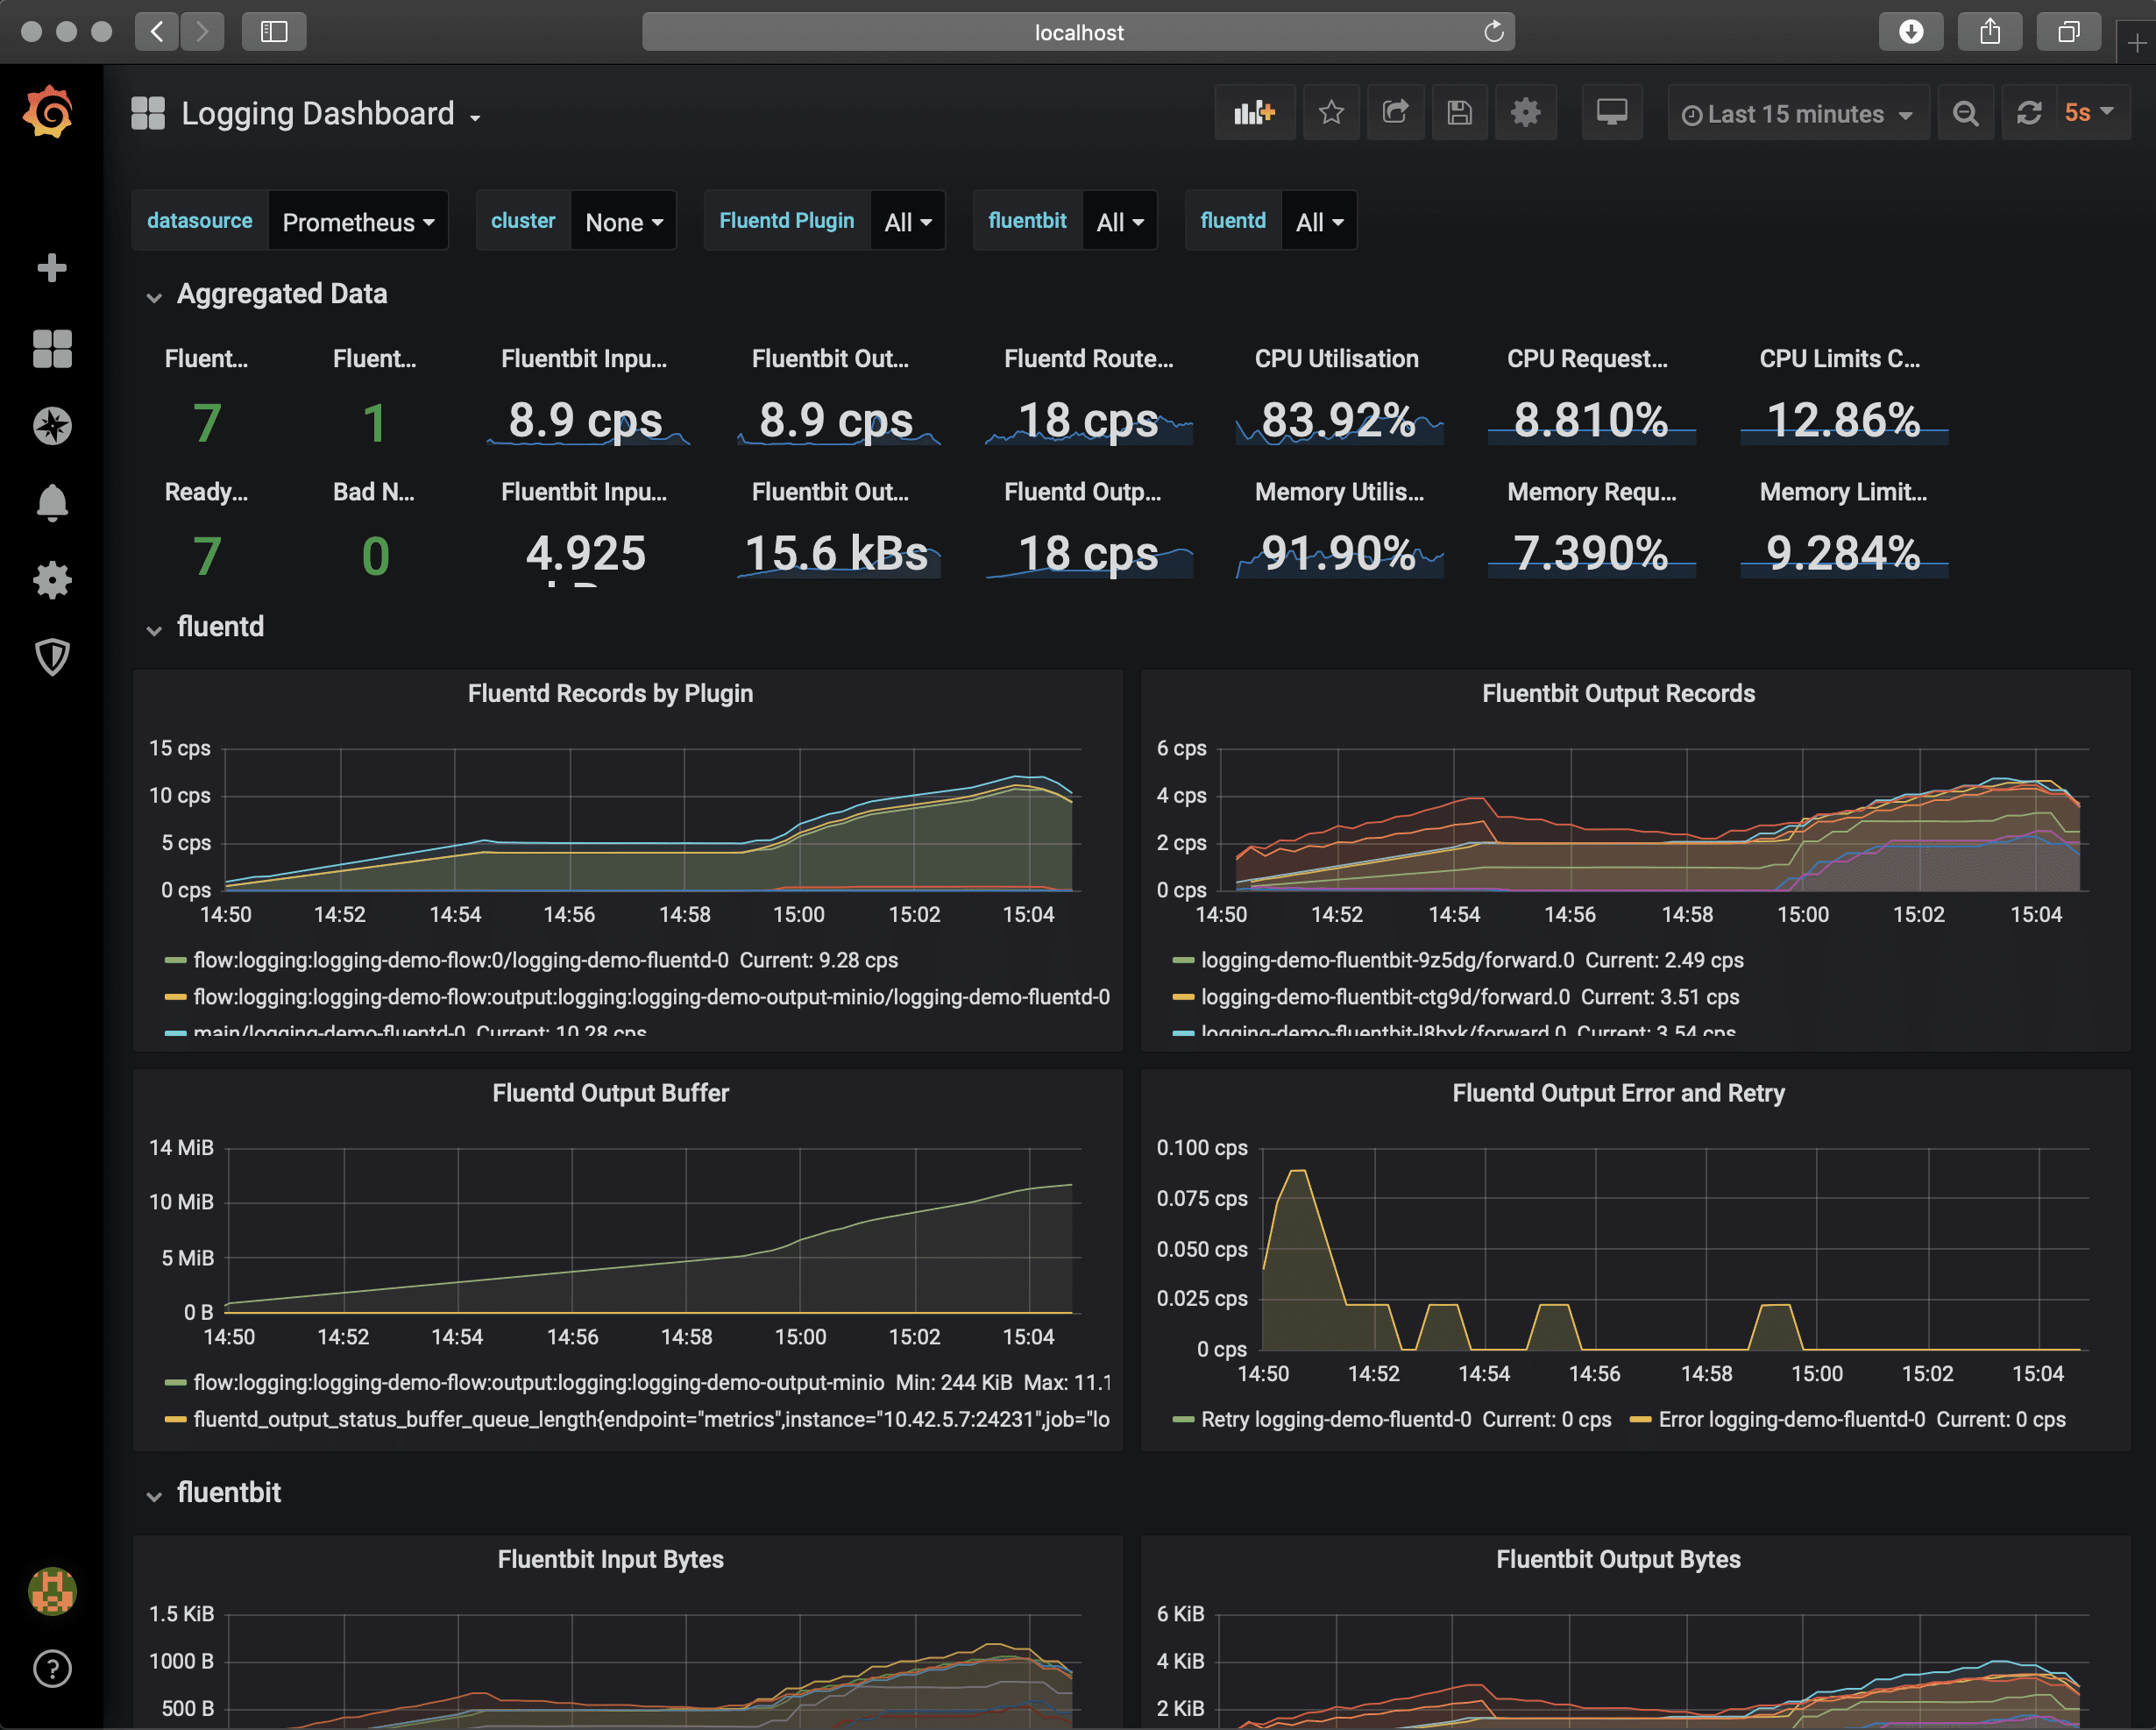
This dashboard monitors the health and throughput of containerized logging pipelines, focusing on Fluent Bit/Fluentd ingestion, routing, and output performance, as well as node and resource status. It highlights per-pod and per-node resource consumption with metrics like kube_pod_info, node_cpu_seconds_total, and kube_node_status_allocatable_cpu_cores, alongside log throughput and buffering metrics such as fluentbit_input_records_total, fluentbit_output_proc_records_total, and fluentd_router_records_total. It also surfaces readiness and health signals with node readiness/condition and buffering/disk activity metrics, enabling quick diagnosis of bottlenecks in input, route, and output stages.
Screenshots
Used Metrics 2929
:node_memory_MemAvailable_bytes:sum
fluentbit_input_bytes_total
fluentbit_input_records_total
fluentbit_output_dropped_records_total
fluentbit_output_errors_total
fluentbit_output_proc_bytes_total
fluentbit_output_proc_records_total
fluentbit_output_retried_records_total
fluentbit_output_retries_failed_total
fluentbit_output_retries_total
fluentd_output_status_buffer_queue_length
fluentd_output_status_buffer_total_bytes
fluentd_output_status_emit_count
fluentd_output_status_emit_records
fluentd_output_status_num_errors
fluentd_output_status_retry_count
fluentd_router_records_total
kube_node_status_allocatable_cpu_cores
kube_node_status_allocatable_memory_bytes
kube_node_status_condition
kube_pod_container_resource_limits_cpu_cores
kube_pod_container_resource_limits_memory_bytes
kube_pod_container_resource_requests_cpu_cores
kube_pod_container_resource_requests_memory_bytes
kube_pod_info
-
node_cpu_seconds_total
-
node_filesystem_free_bytes
-
node_filesystem_size_bytes
topk