Linkerd Route Dashboard 4,2234,223
3/8/2020
3/8/2020
1
>=6.6.1
Prometheus
Description
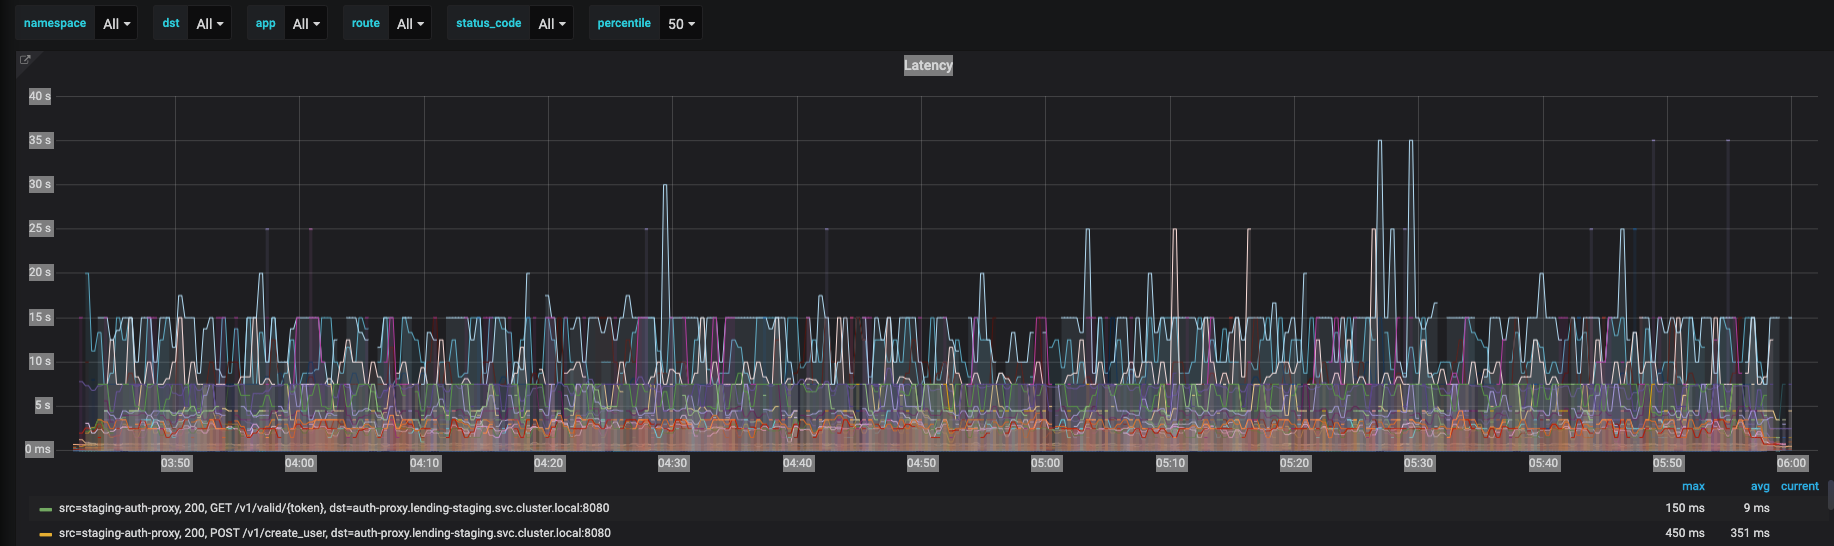
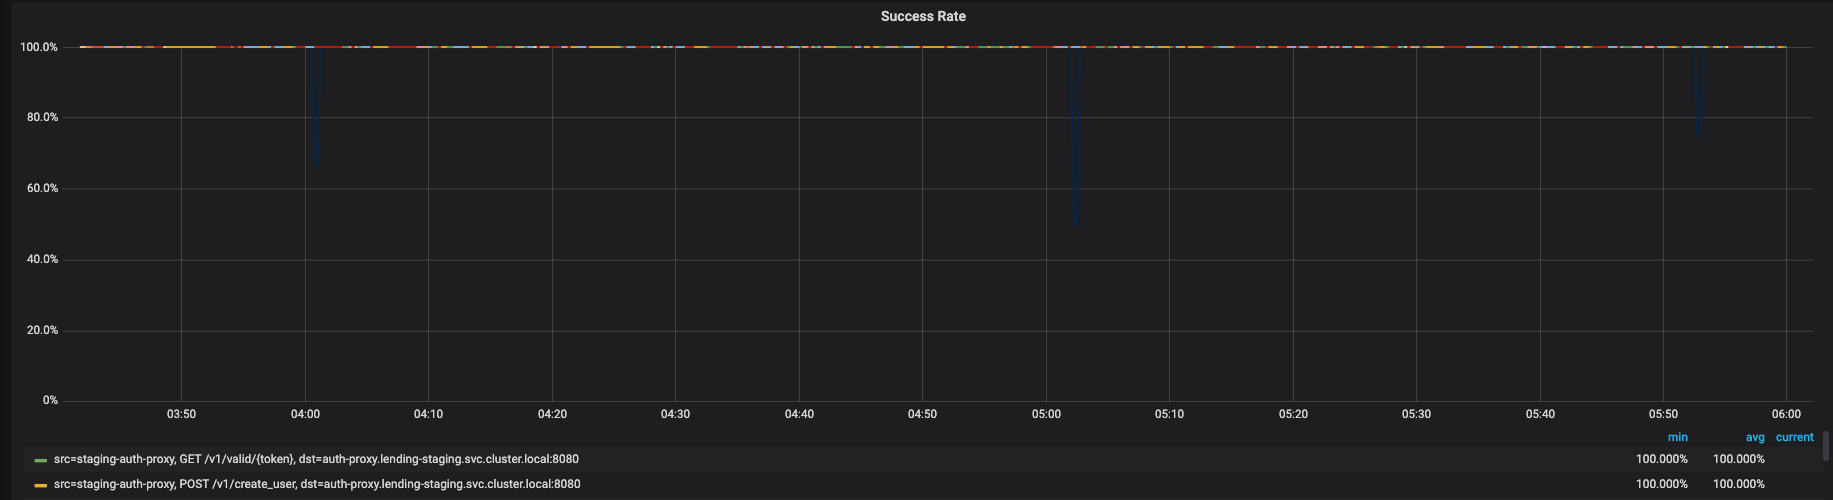
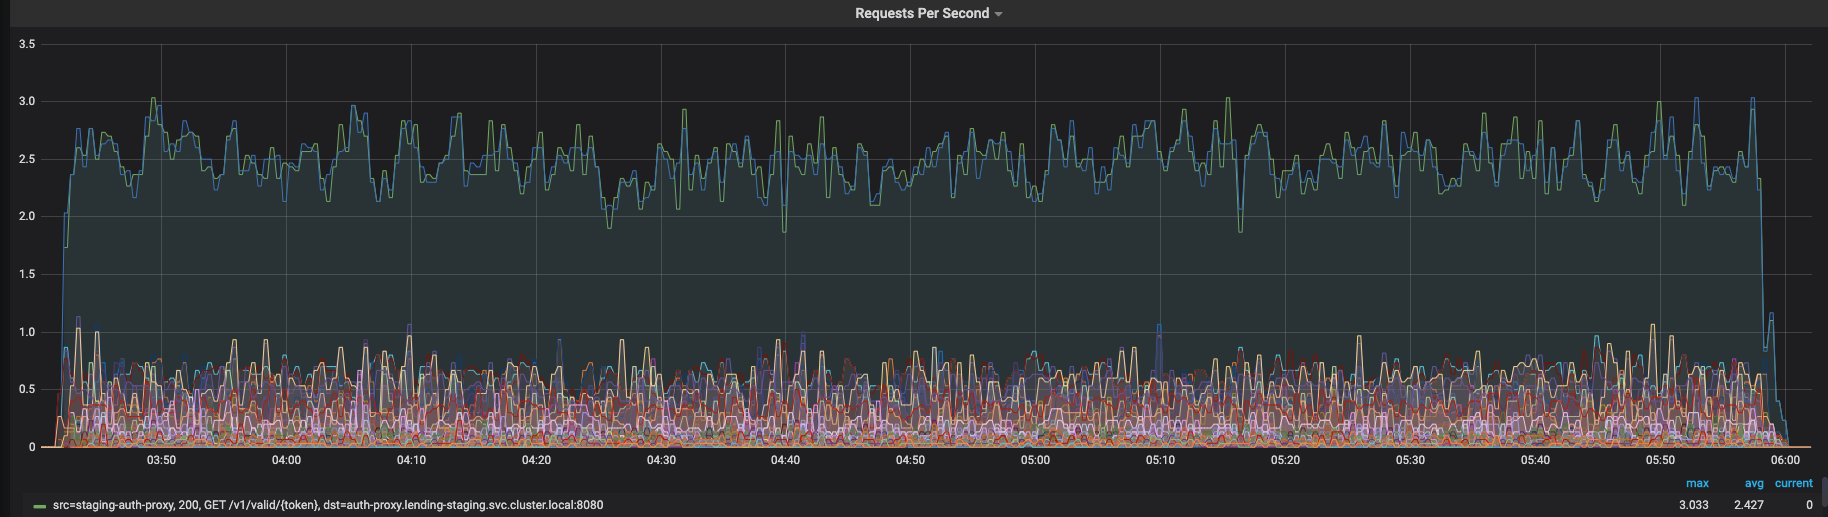
Latency, success rate, rate per second, by app, status_code, destination, and route
Screenshots
Used Metrics 33
percentile
route_response_latency_ms_bucket
route_response_total
Get Dashboard✕
Download
Copy to Clipboard