Lightweight APM for OpenTelemetry 3,3503,350
Description
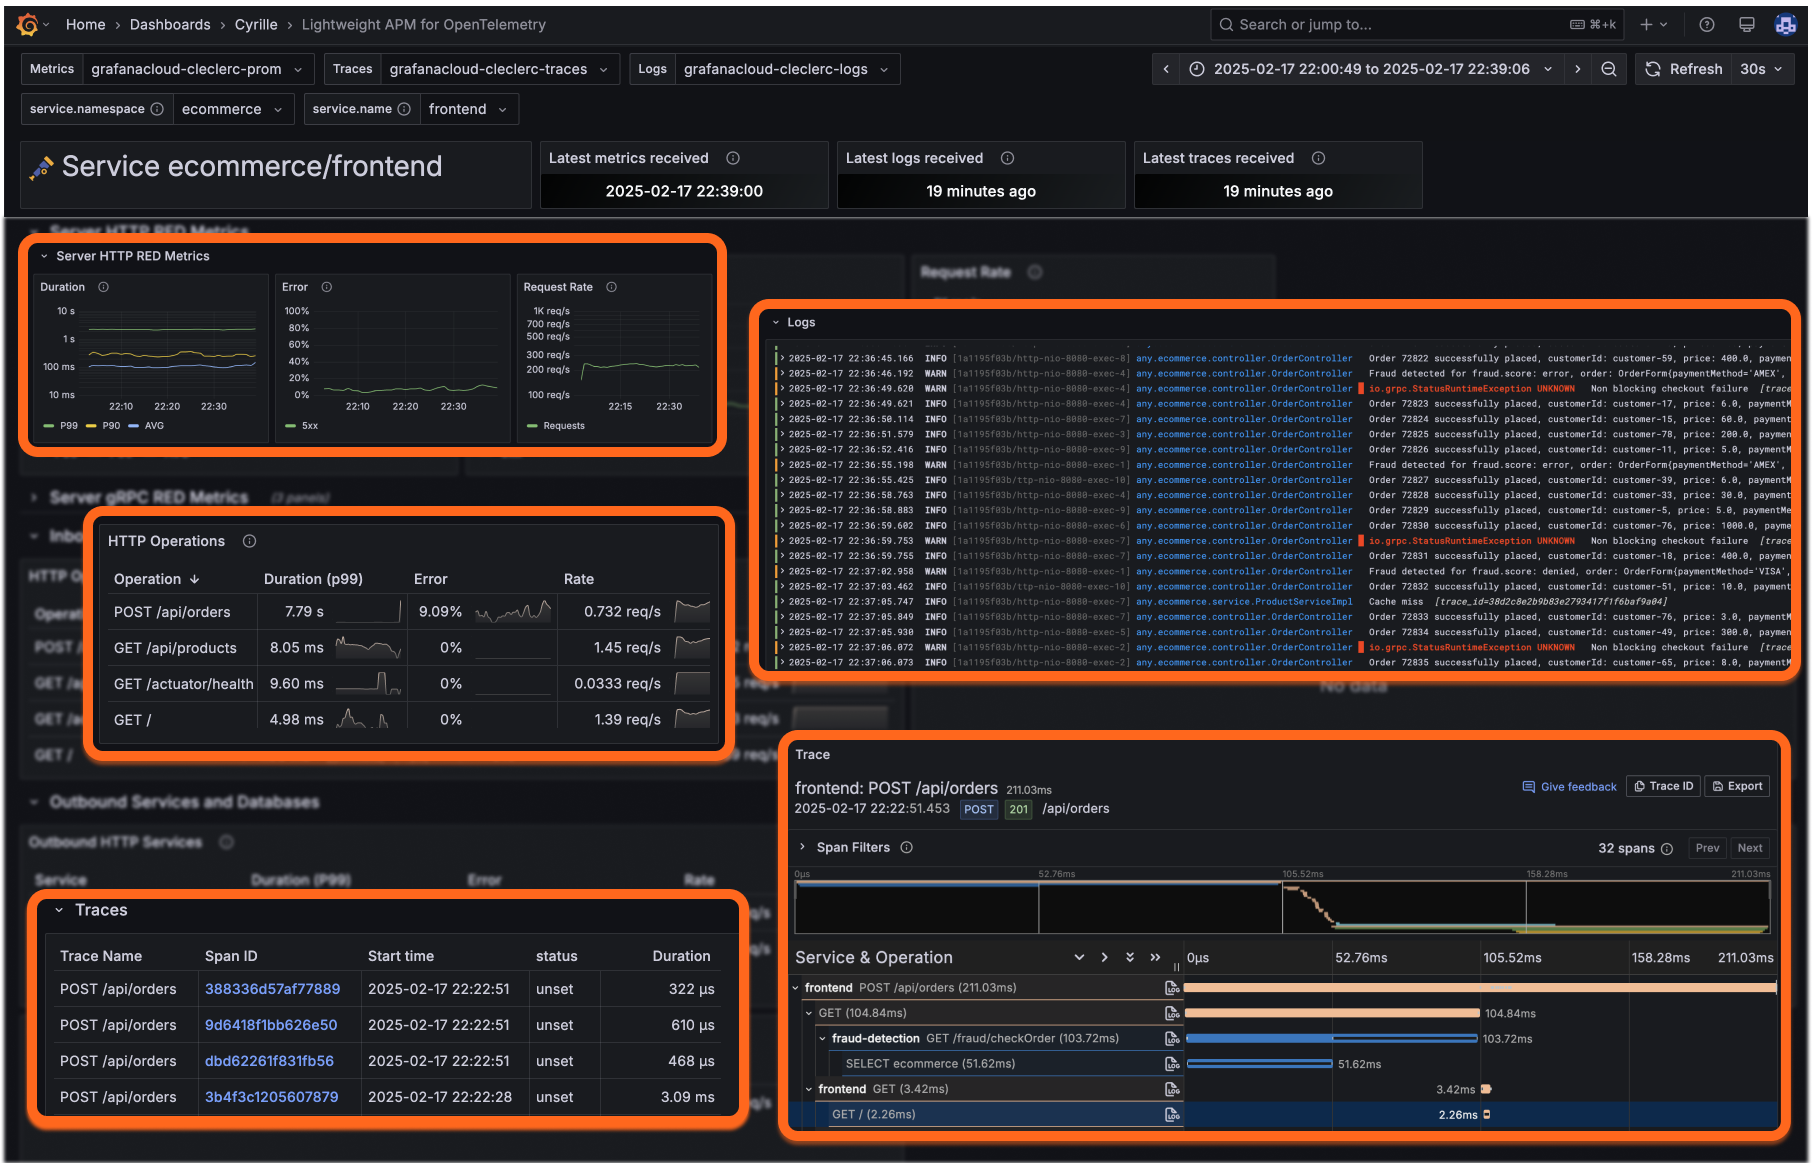
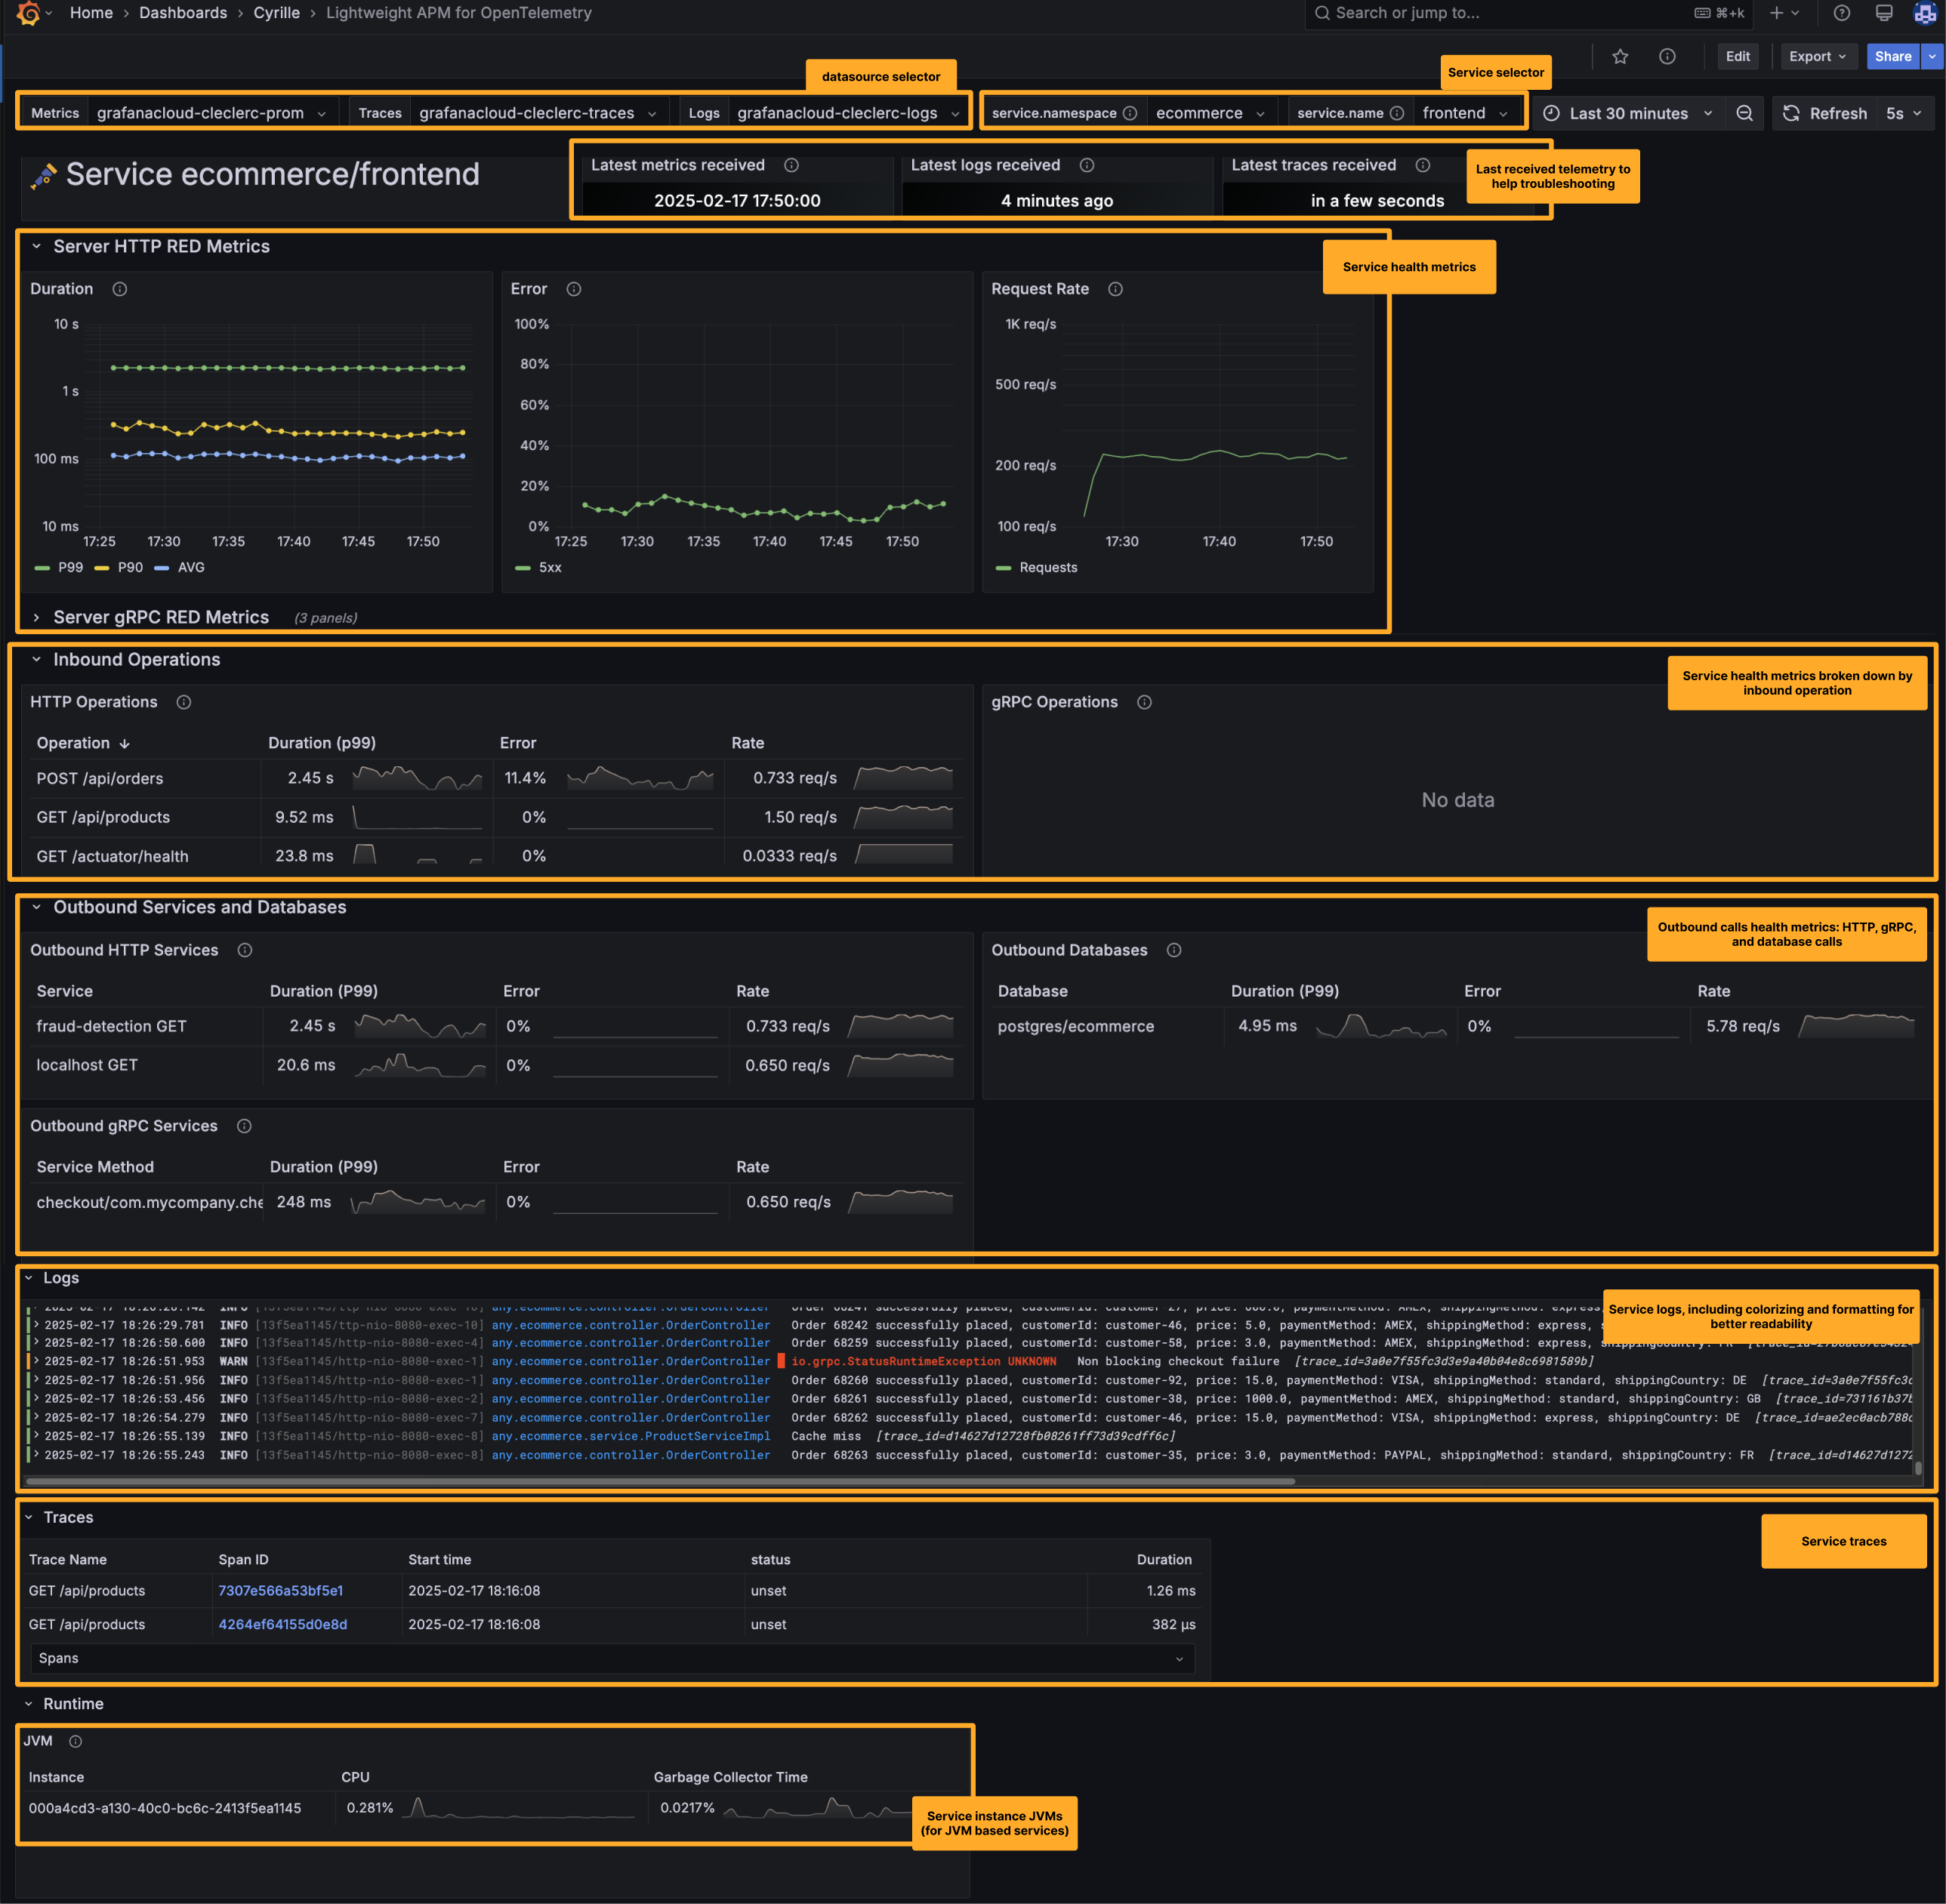
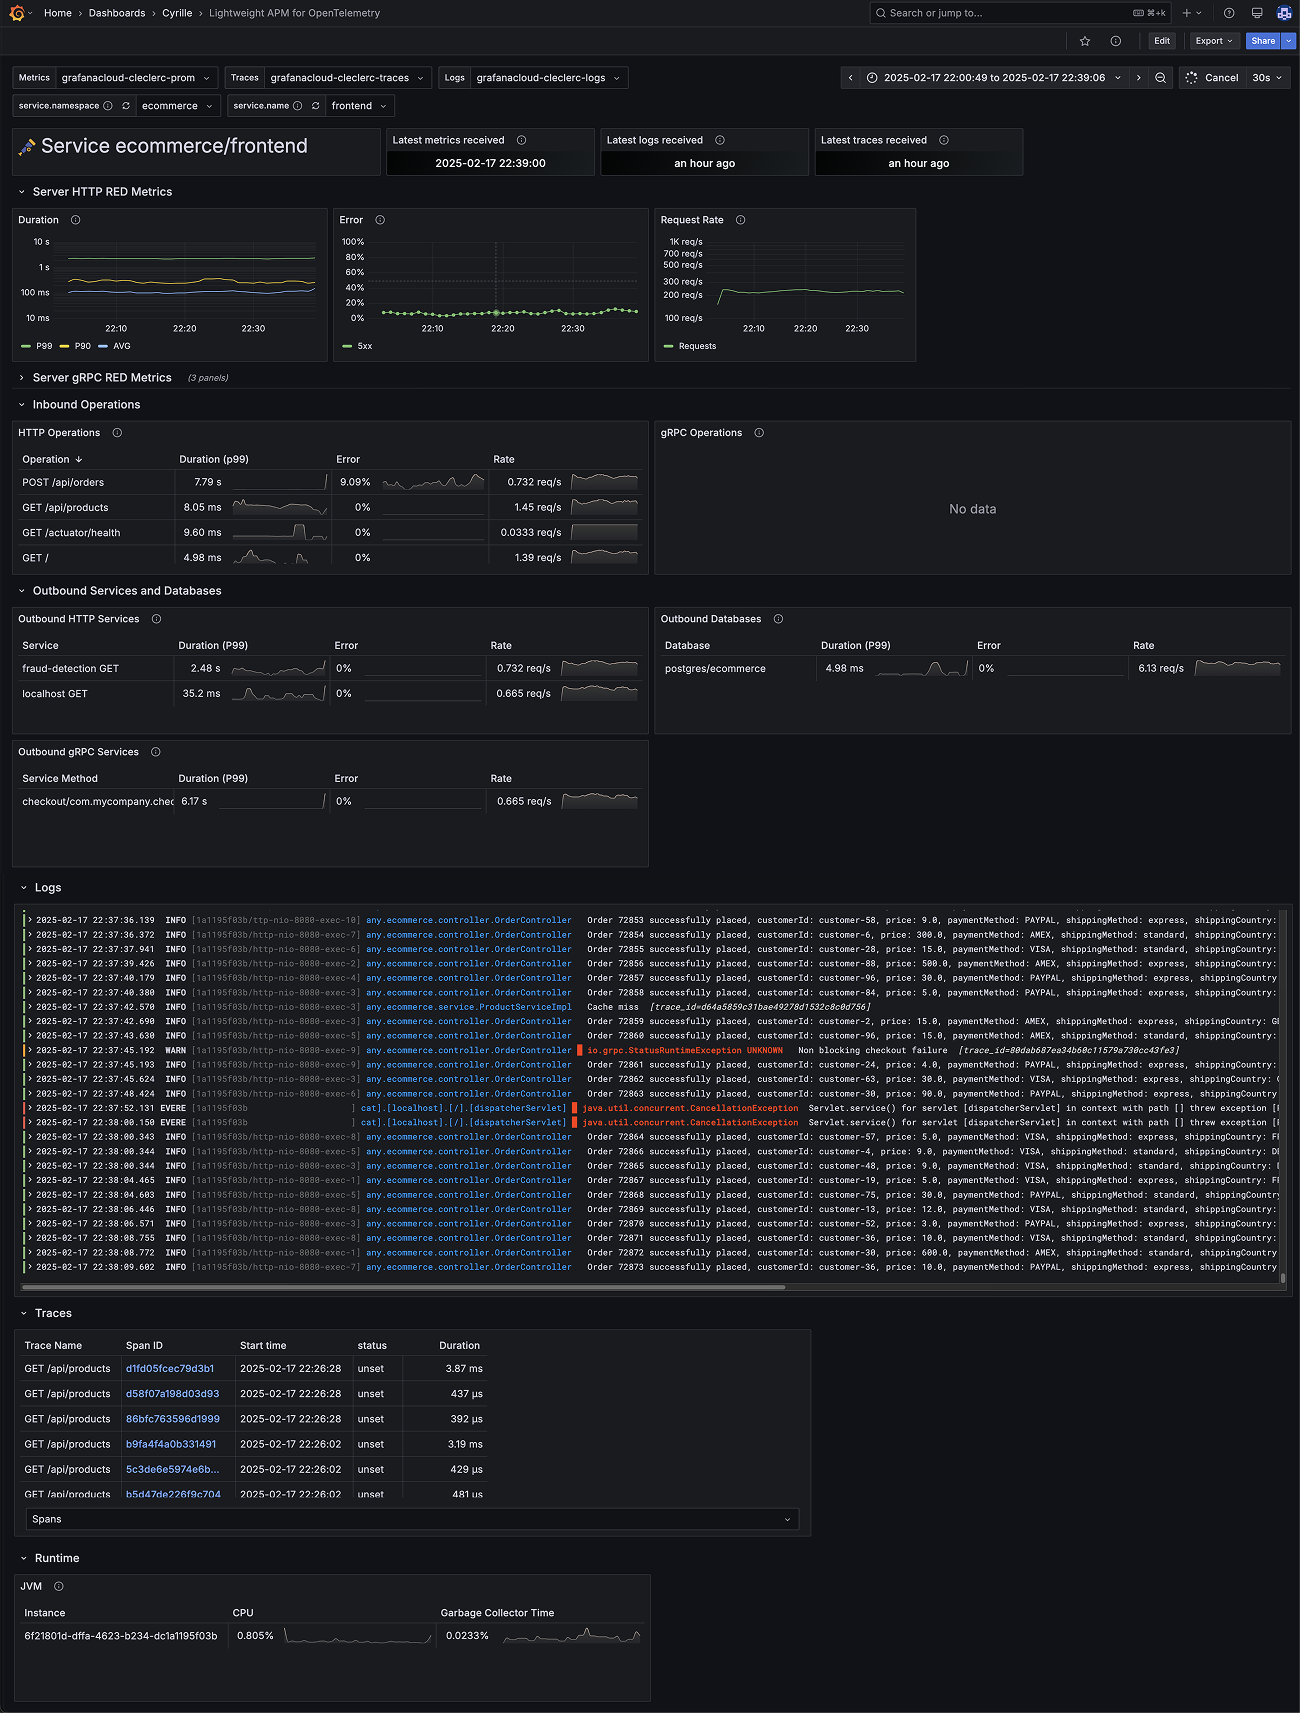
Lightweight APM dashboard for monitoring OpenTelemetry-based services.
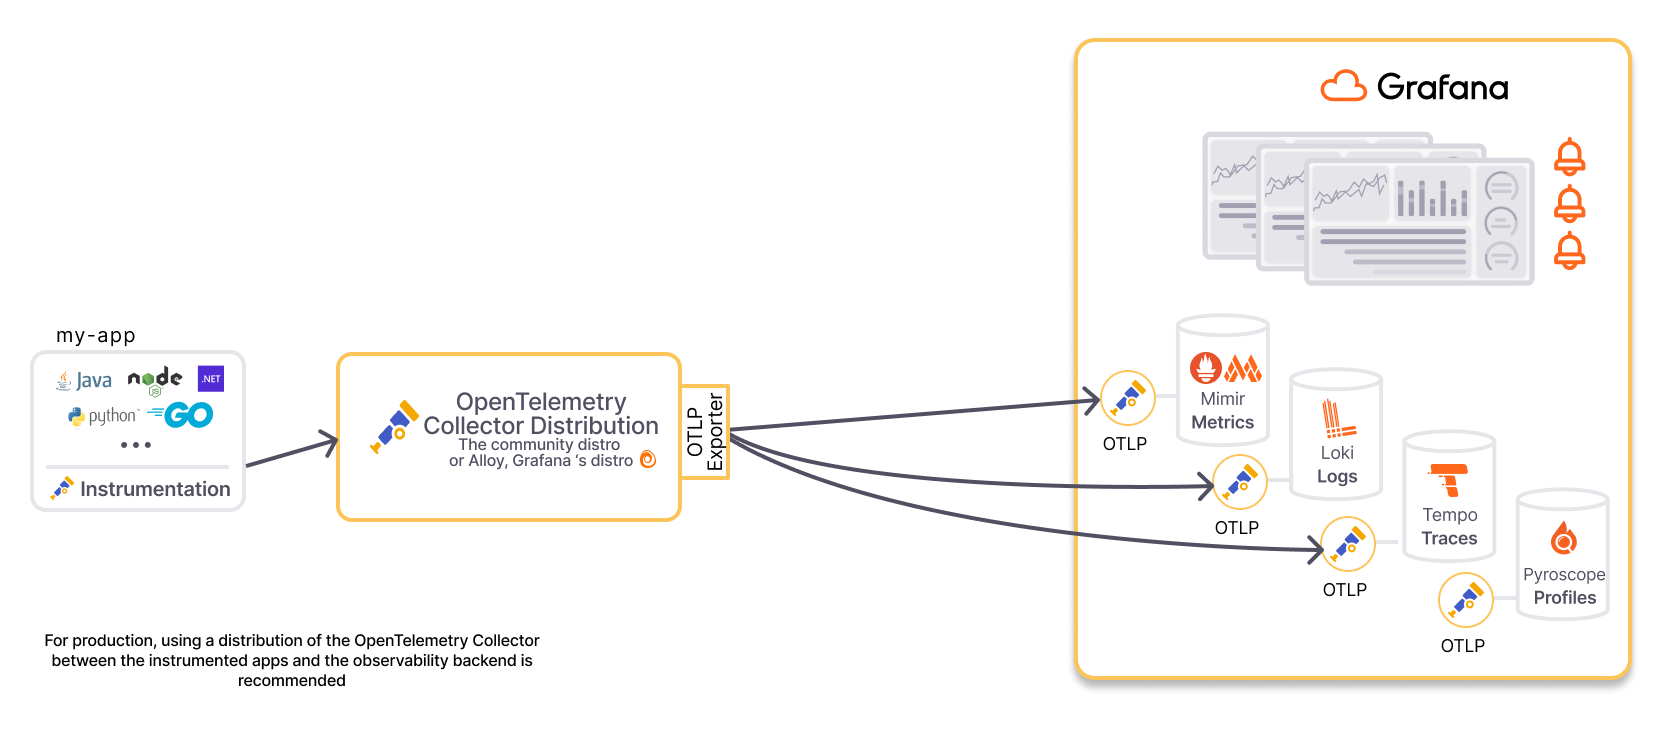
Instrument your applications using OpenTelemetry SDKs and send traces, metrics, and logs to Tempo for traces, a Prometheus-compatible database like Mimir for metrics, and Loki for logs. This dashboard provides a centralized view of your application's health and performance.
For a fully managed observability stack, consider using Grafana Cloud.
Learn more about this dashboard on https://github.com/cyrille-leclerc/opentelemetry-service-dashboard.
Screenshots
Used Metrics 2727
database
db_client_operation_duration_seconds_bucket
db_client_operation_duration_seconds_count
db_namespace
http_client_request_duration_seconds_bucket
http_client_request_duration_seconds_count
http_request_method
http_route
http_server_request_duration_seconds_bucket
http_server_request_duration_seconds_count
http_server_request_duration_seconds_sum
jvm_cpu_recent_utilization_ratio
jvm_gc_duration_seconds_sum
line_format
operation
outbound_service
rpc_client_duration_milliseconds_bucket
rpc_client_duration_milliseconds_count
rpc_method
rpc_server_duration_milliseconds_bucket
rpc_server_duration_milliseconds_count
rpc_service
server_address
target_info
timestamp
trace_id
url_template