Libvirt Dashboard 1,3161,316
Description
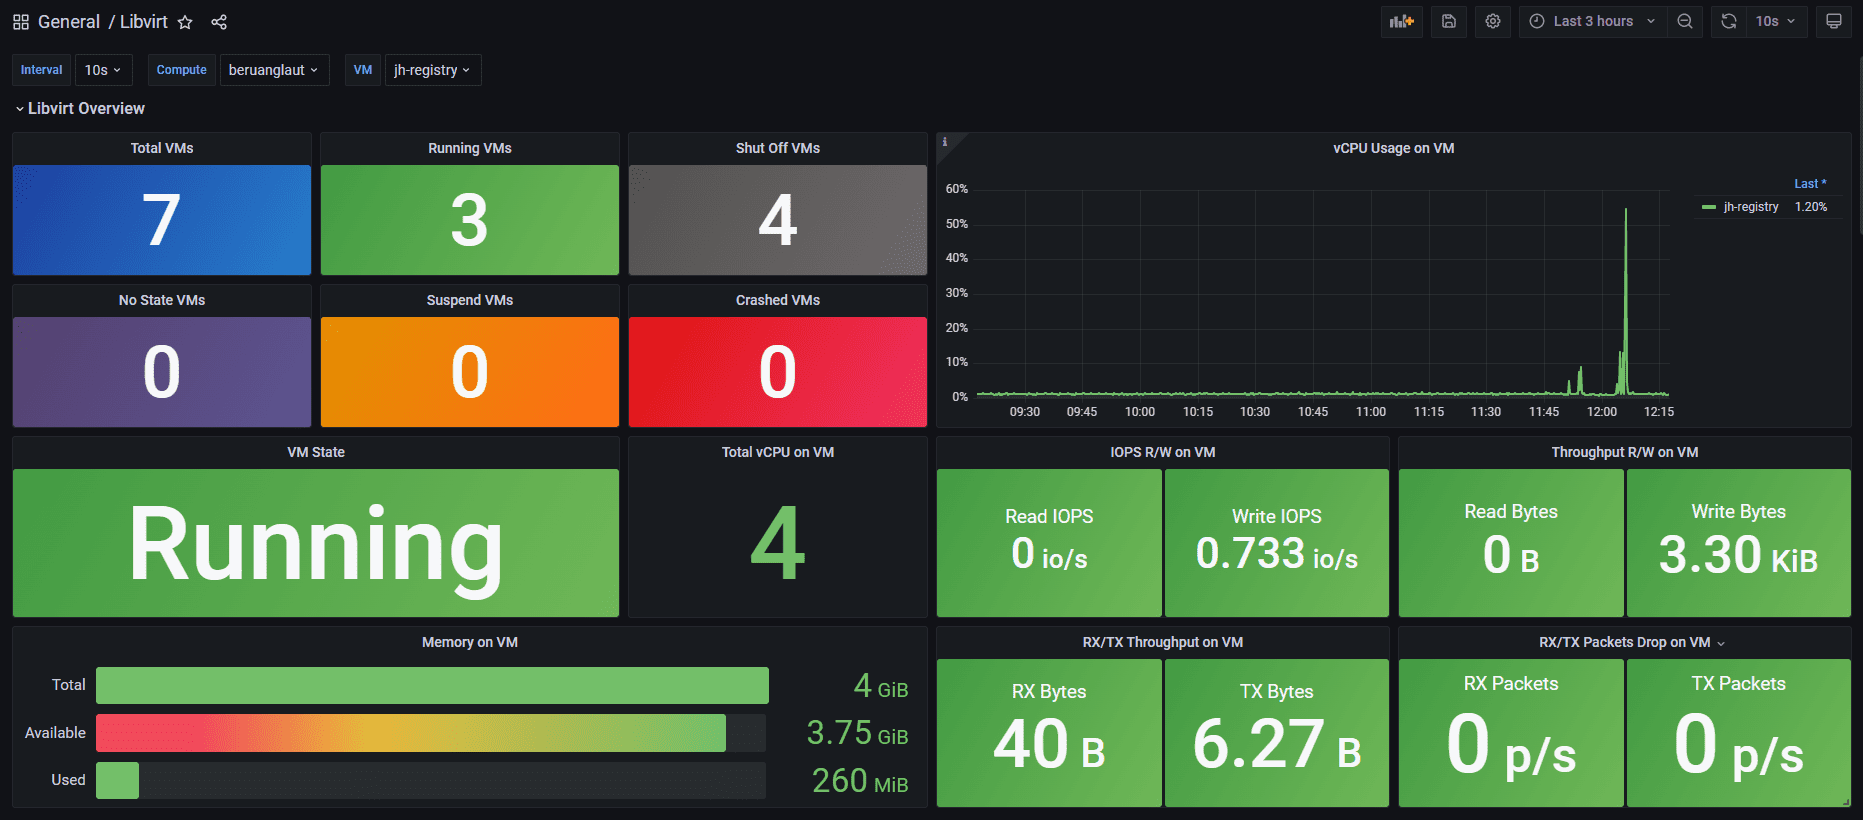
A simple dashboard that can monitor libvirt KVM
Screenshots
Used Metrics 2121
libvirt_domain_block_stats_read_bytes_total
libvirt_domain_block_stats_read_requests_total
libvirt_domain_block_stats_write_bytes_total
libvirt_domain_block_stats_write_requests_total
libvirt_domain_info_cpu_time_seconds_total
libvirt_domain_info_maximum_memory_bytes
libvirt_domain_info_virtual_cpus
libvirt_domain_interface_stats_receive_bytes_total
libvirt_domain_interface_stats_receive_drops_total
libvirt_domain_interface_stats_receive_errors_total
libvirt_domain_interface_stats_receive_packets_total
libvirt_domain_interface_stats_transmit_bytes_total
libvirt_domain_interface_stats_transmit_drops_total
libvirt_domain_interface_stats_transmit_errors_total
libvirt_domain_interface_stats_transmit_packets_total
libvirt_domain_stat_memory_rss_bytes
libvirt_domain_stat_memory_swap_in_bytes
libvirt_domain_stat_memory_swap_out_bytes
libvirt_domain_stat_memory_unused_bytes
libvirt_domain_state_code
libvirt_domains_number