latency 65,55765,557
11/2/2020
12/17/2021
4
>=7.3.1
Description
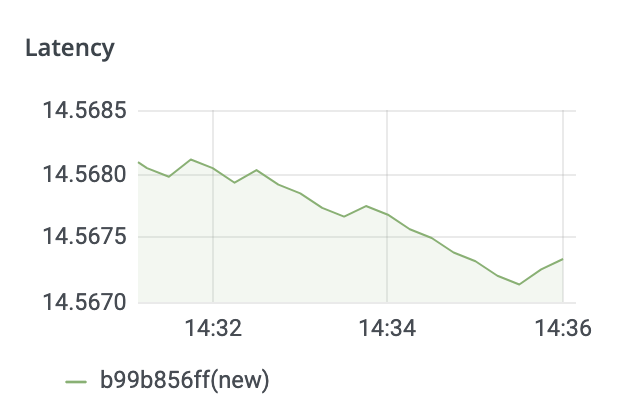
This dashboard monitors latency characteristics across services by visualizing percentile-based latency and request timing data. It highlights key metrics such as percentile, envoy_cluster_upstream_rq_time_bucket, and rollouts_pod_template_hash to track percentile latency, upstream request duration distributions, and deployment version freshness. Panels likely cover distribution overview, upstream latency breakdown, and rollout/version stability to correlate latency with deployment changes and instance health.
Screenshots
Used Metrics 55
envoy_cluster_upstream_rq_time_bucket
new
new_rollout_pod_template_hash
percentile
rollouts_pod_template_hash
Get Dashboard✕
Download
Copy to Clipboard