Kubernetes / Views / Pods 9,982,8179,982,817 5.0 (1 reviews)
Description
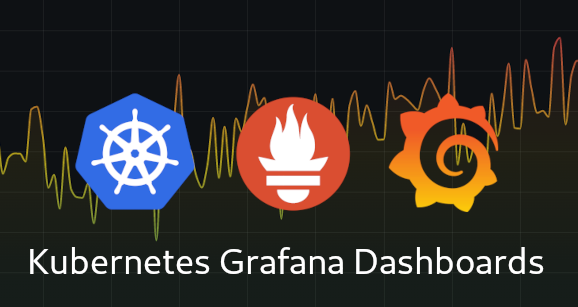
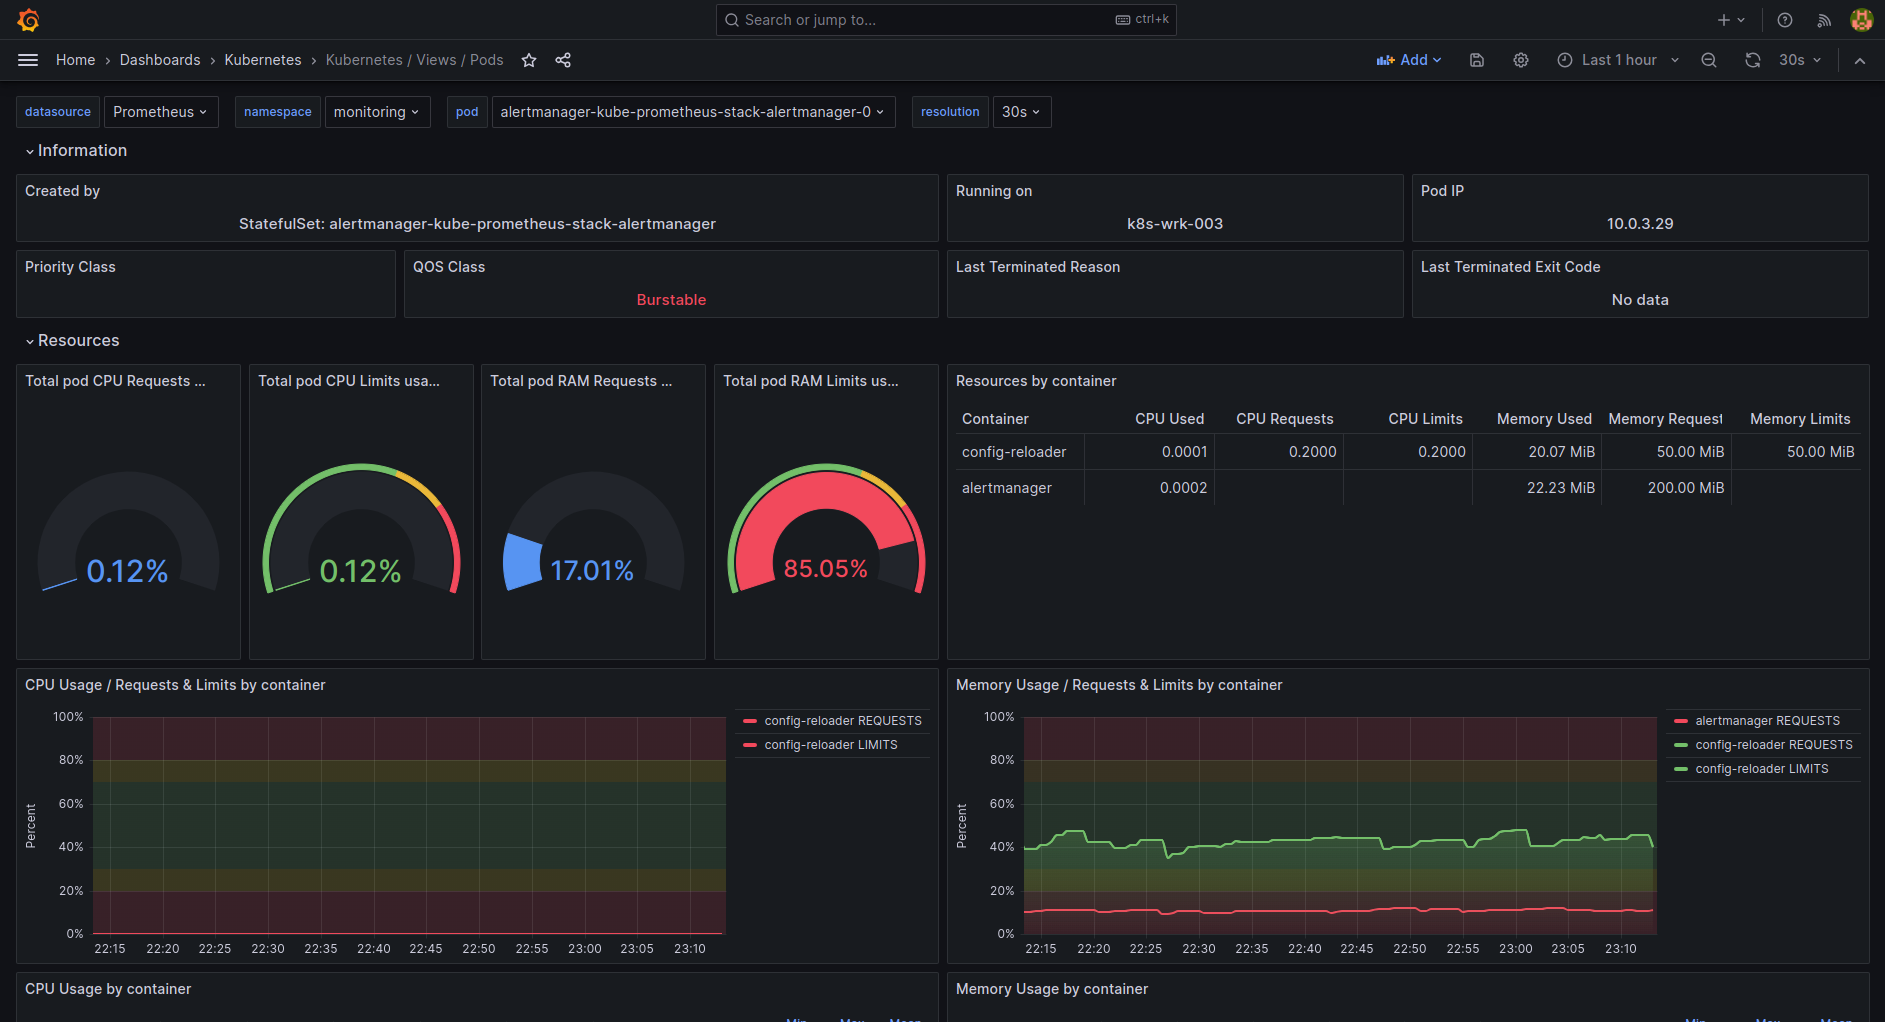
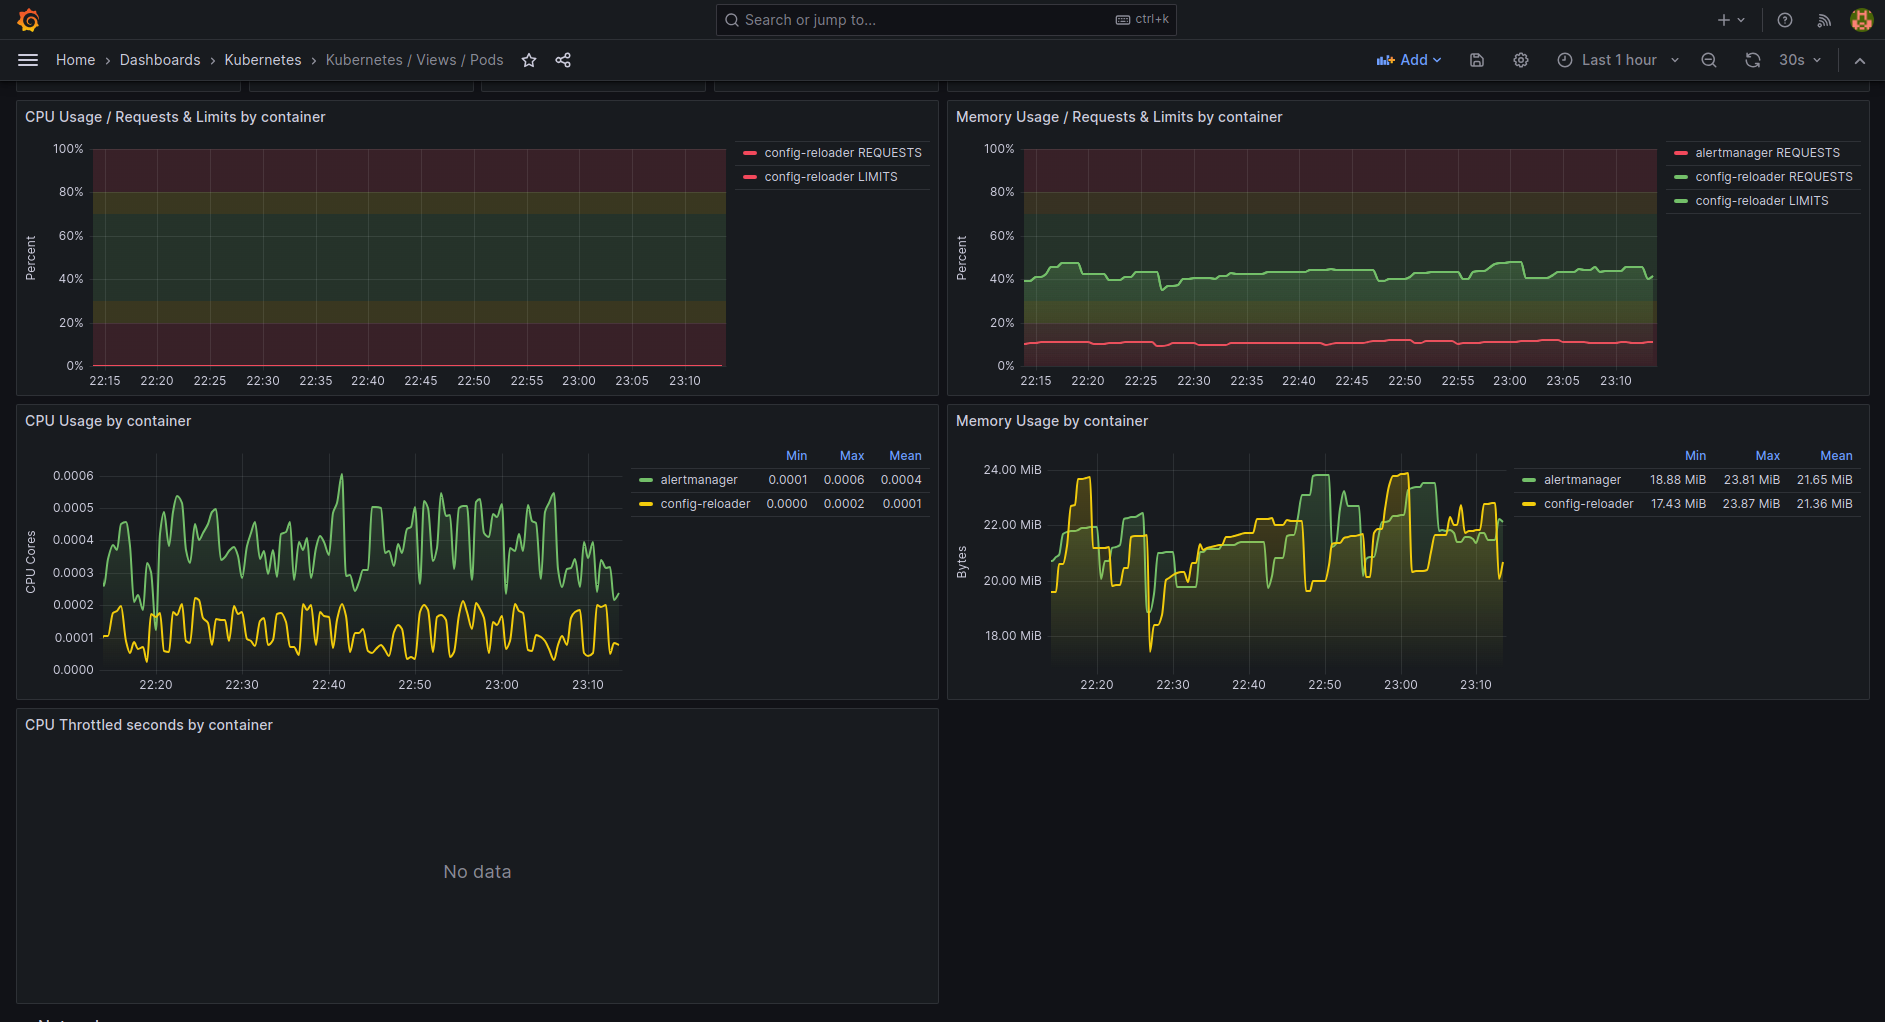
This dashboard monitors Kubernetes pod health, resource usage, and lifecycle events with a focus on container-level details. It surfaces metrics such as kube_pod_info and kube_pod_status_qos_class for pod characterization, and tracks resource requests/limits alongside actual usage through panels like Total pod CPU Requests usage, Total pod RAM Limits usage, and CPU Usage by container / Memory Usage by container to identify potential bottlenecks. It also highlights stability indicators such as kube_pod_container_status_last_terminated_reason, container_oom_events_total, and Container Restarts by container to surface failures and OOM/exit reasons at a granular container level.
Screenshots
Used Metrics 2525
cluster
container
-
container_cpu_cfs_throttled_seconds_total
-
container_cpu_usage_seconds_total
-
container_memory_working_set_bytes
-
container_network_receive_bytes_total
-
container_network_receive_errors_total
-
container_network_receive_packets_dropped_total
-
container_network_receive_packets_total
-
container_network_transmit_bytes_total
-
container_network_transmit_errors_total
-
container_network_transmit_packets_dropped_total
-
container_network_transmit_packets_total
-
container_oom_events_total
job
kube_pod_container_resource_limits
kube_pod_container_resource_requests
kube_pod_container_status_last_terminated_exitcode
kube_pod_container_status_last_terminated_reason
kube_pod_container_status_restarts_total
kube_pod_container_status_waiting_reason
kube_pod_info
kube_pod_status_qos_class
kube_pod_status_scheduled
pod