Kubernetes / Views / Nodes 8,443,3058,443,305 5.0 (1 reviews)
Description
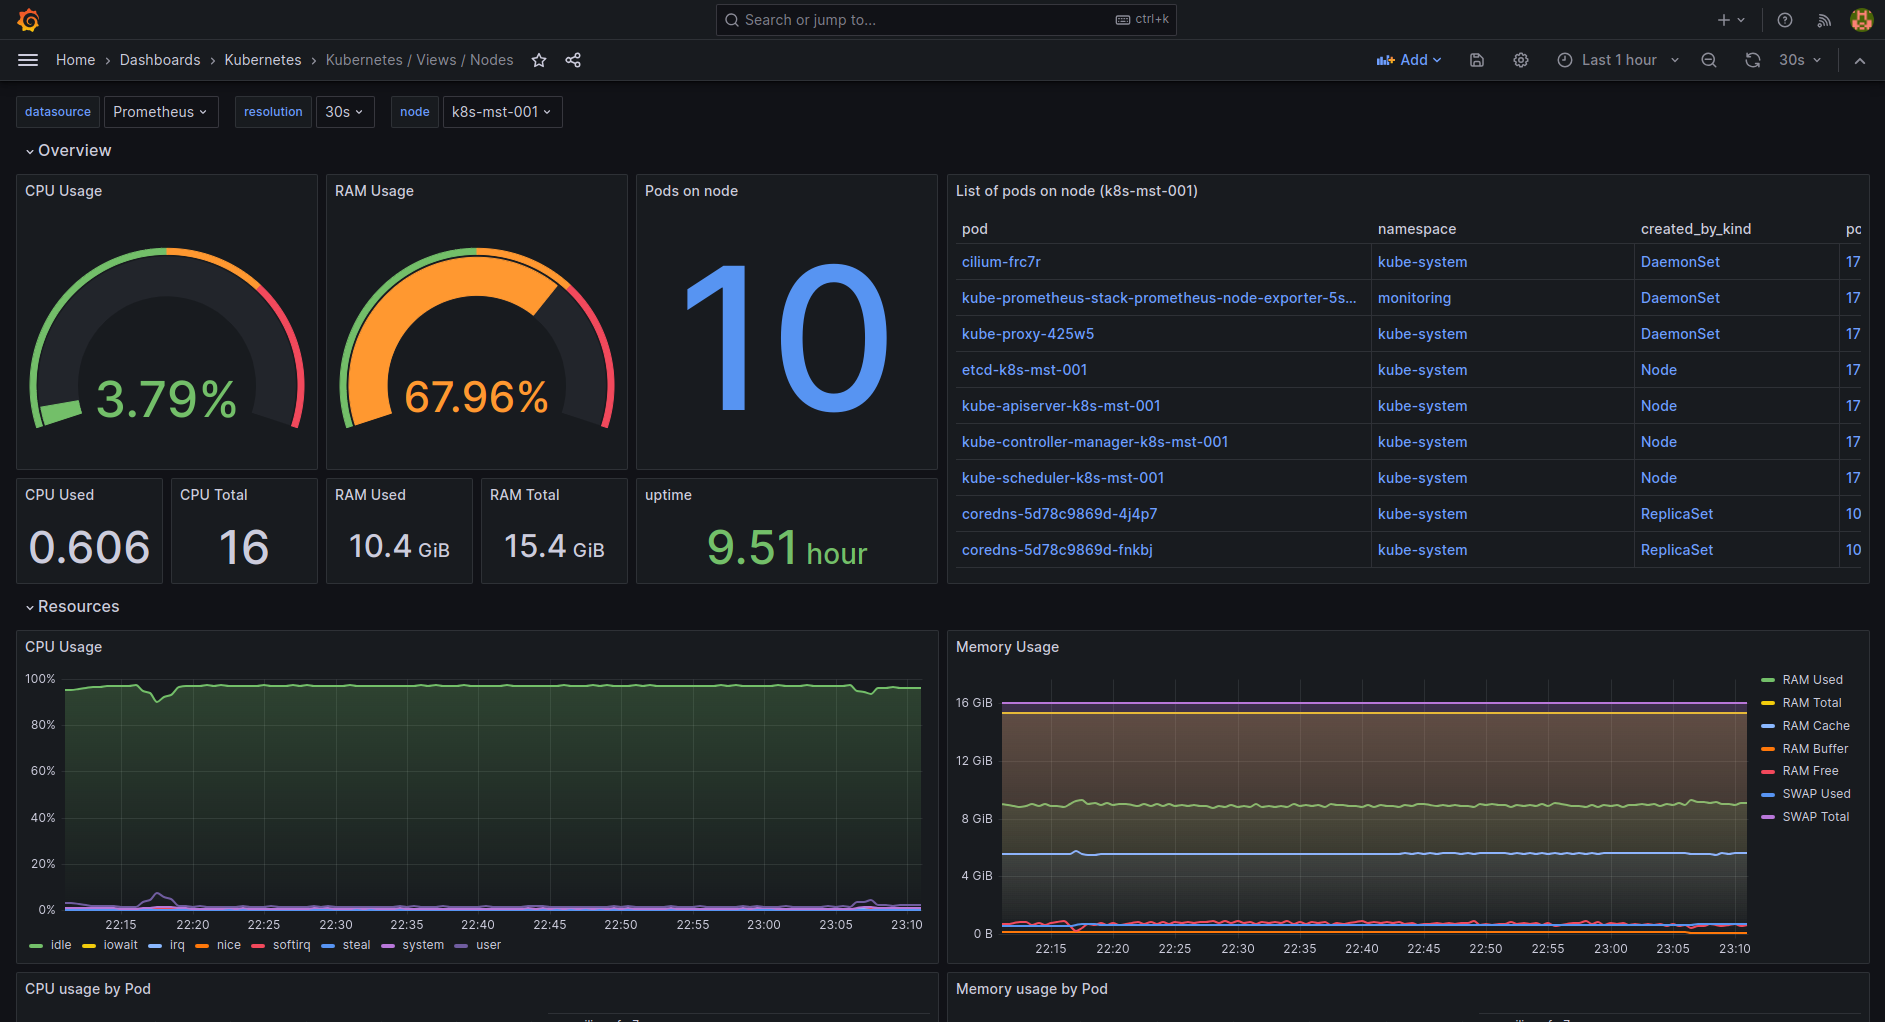
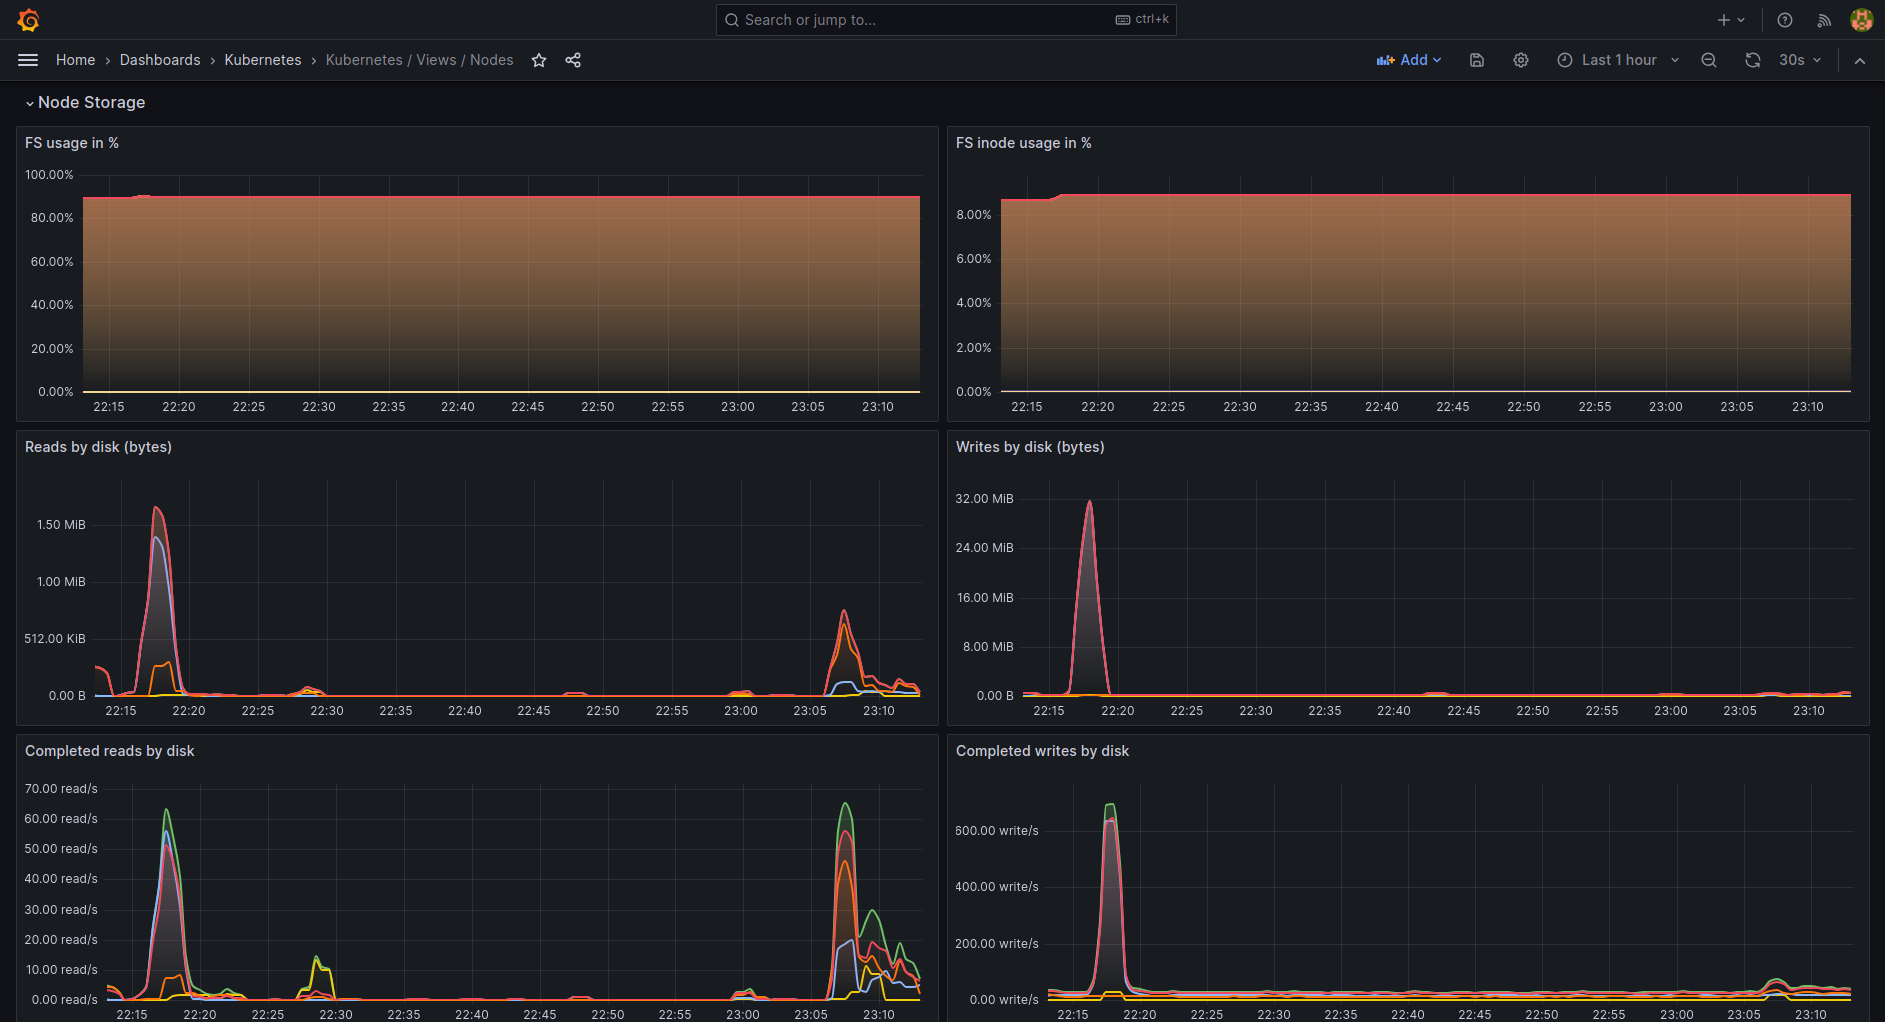
This dashboard monitors per-node health and resource utilization in a Kubernetes cluster, aggregating system, pod, and network metrics to give a comprehensive view of node performance. It highlights key metrics such as node_cpu_seconds_total, node_memory_MemTotal_bytes (and related memory usage like node_memory_MemAvailable_bytes), and machine_cpu_cores to quantify CPU capacity, usage, and memory availability, while panels like CPU Usage, RAM Usage, and Pods on node provide actionable, at-a-glance insights for capacity planning and troubleshooting.
Screenshots

Used Metrics 5050
-
container_cpu_usage_seconds_total
-
container_memory_working_set_bytes
kube_pod_info
kubelet_volume_stats_capacity_bytes
kubelet_volume_stats_inodes
kubelet_volume_stats_inodes_used
kubelet_volume_stats_used_bytes
-
machine_cpu_cores
-
machine_memory_bytes
-
node_boot_time_seconds
-
node_context_switches_total
node_cpu_core_throttles_total
-
node_cpu_seconds_total
-
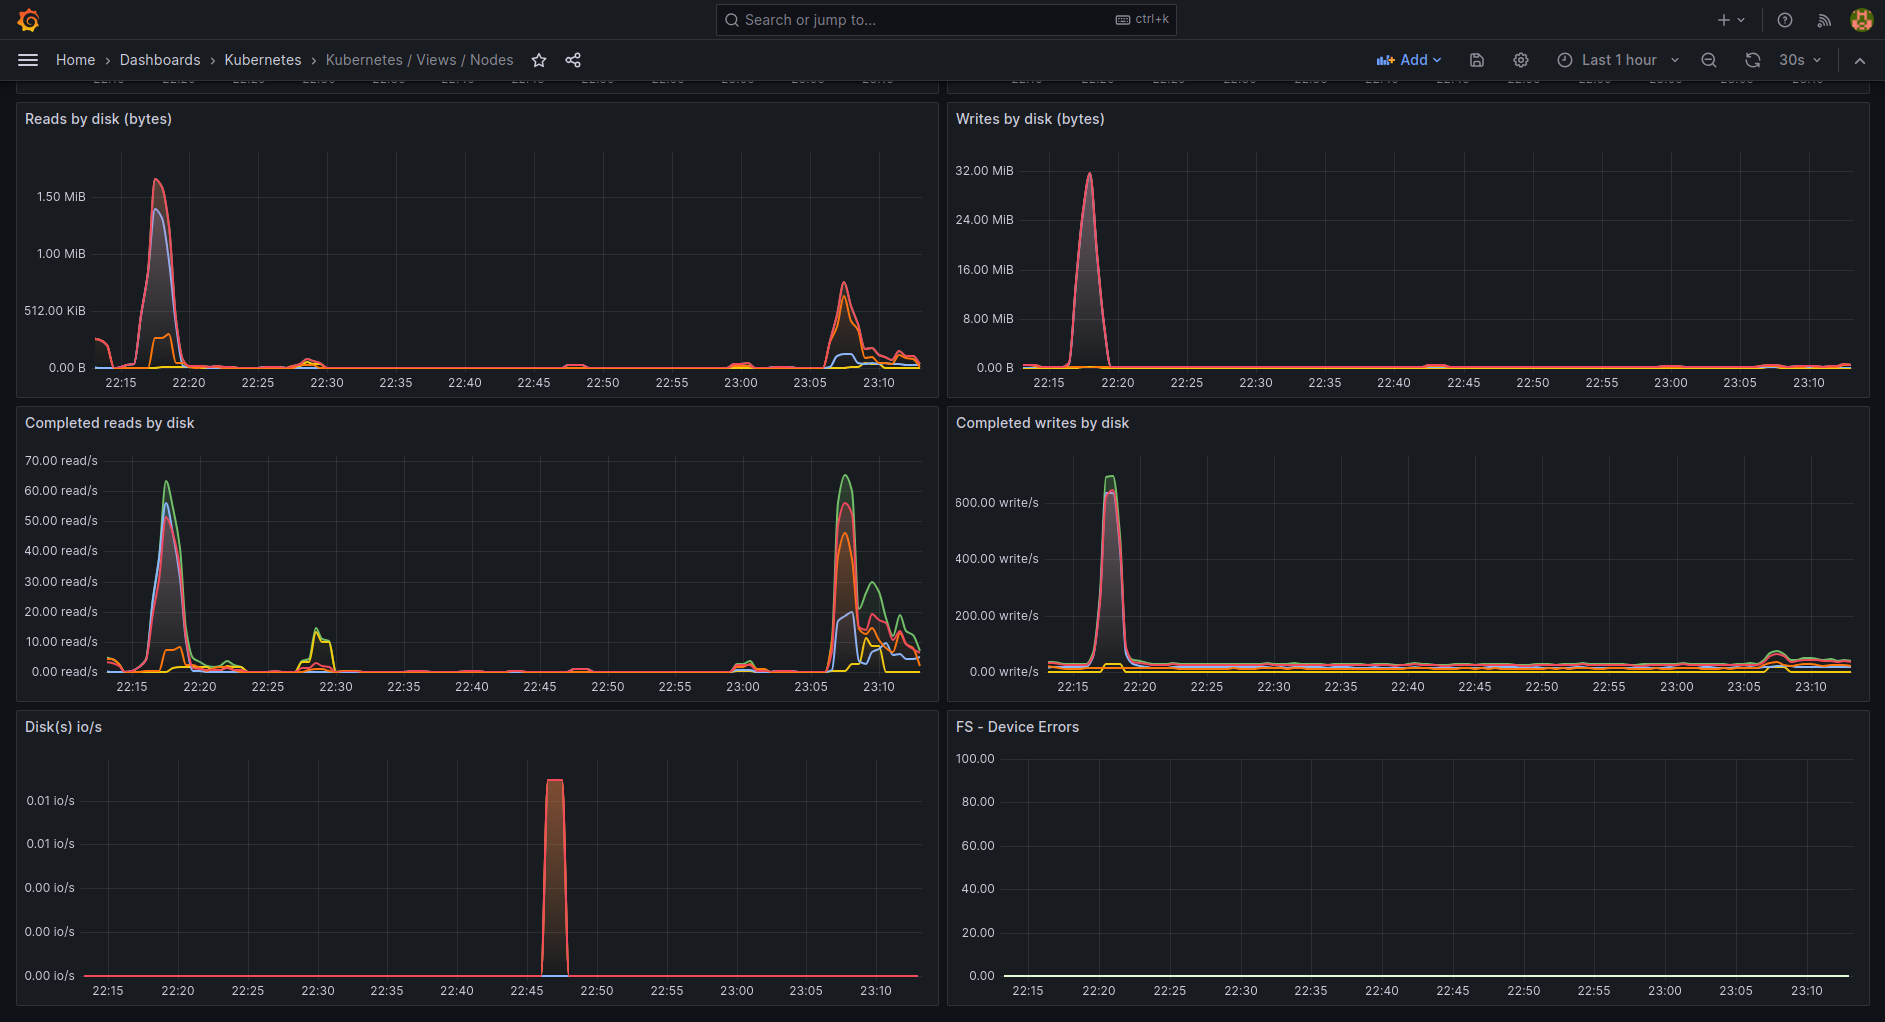
node_disk_io_now
-
node_disk_read_bytes_total
-
node_disk_reads_completed_total
-
node_disk_writes_completed_total
-
node_disk_written_bytes_total
-
node_filefd_allocated
-
node_filefd_maximum
-
node_filesystem_avail_bytes
-
node_filesystem_device_error
-
node_filesystem_files
-
node_filesystem_files_free
-
node_filesystem_size_bytes
-
node_intr_total
-
node_load1
-
node_load15
-
node_load5
-
node_memory_Buffers_bytes
-
node_memory_Cached_bytes
-
node_memory_MemAvailable_bytes
-
node_memory_MemFree_bytes
-
node_memory_MemTotal_bytes
-
node_memory_SwapFree_bytes
-
node_memory_SwapTotal_bytes
-
node_netstat_Tcp_CurrEstab
-
node_network_receive_bytes_total
-
node_network_receive_drop_total
-
node_network_receive_errs_total
-
node_network_receive_packets_total
-
node_network_transmit_bytes_total
-
node_network_transmit_drop_total
-
node_network_transmit_errs_total
-
node_network_transmit_packets_total
node_nf_conntrack_entries
node_nf_conntrack_entries_limit
-
node_time_seconds
-
node_timex_estimated_error_seconds
-
node_timex_maxerror_seconds