Kubernetes / Views / Namespaces 9,105,3869,105,386 5.0 (2 reviews)
Description
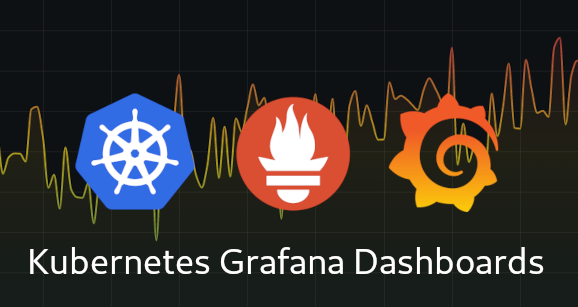
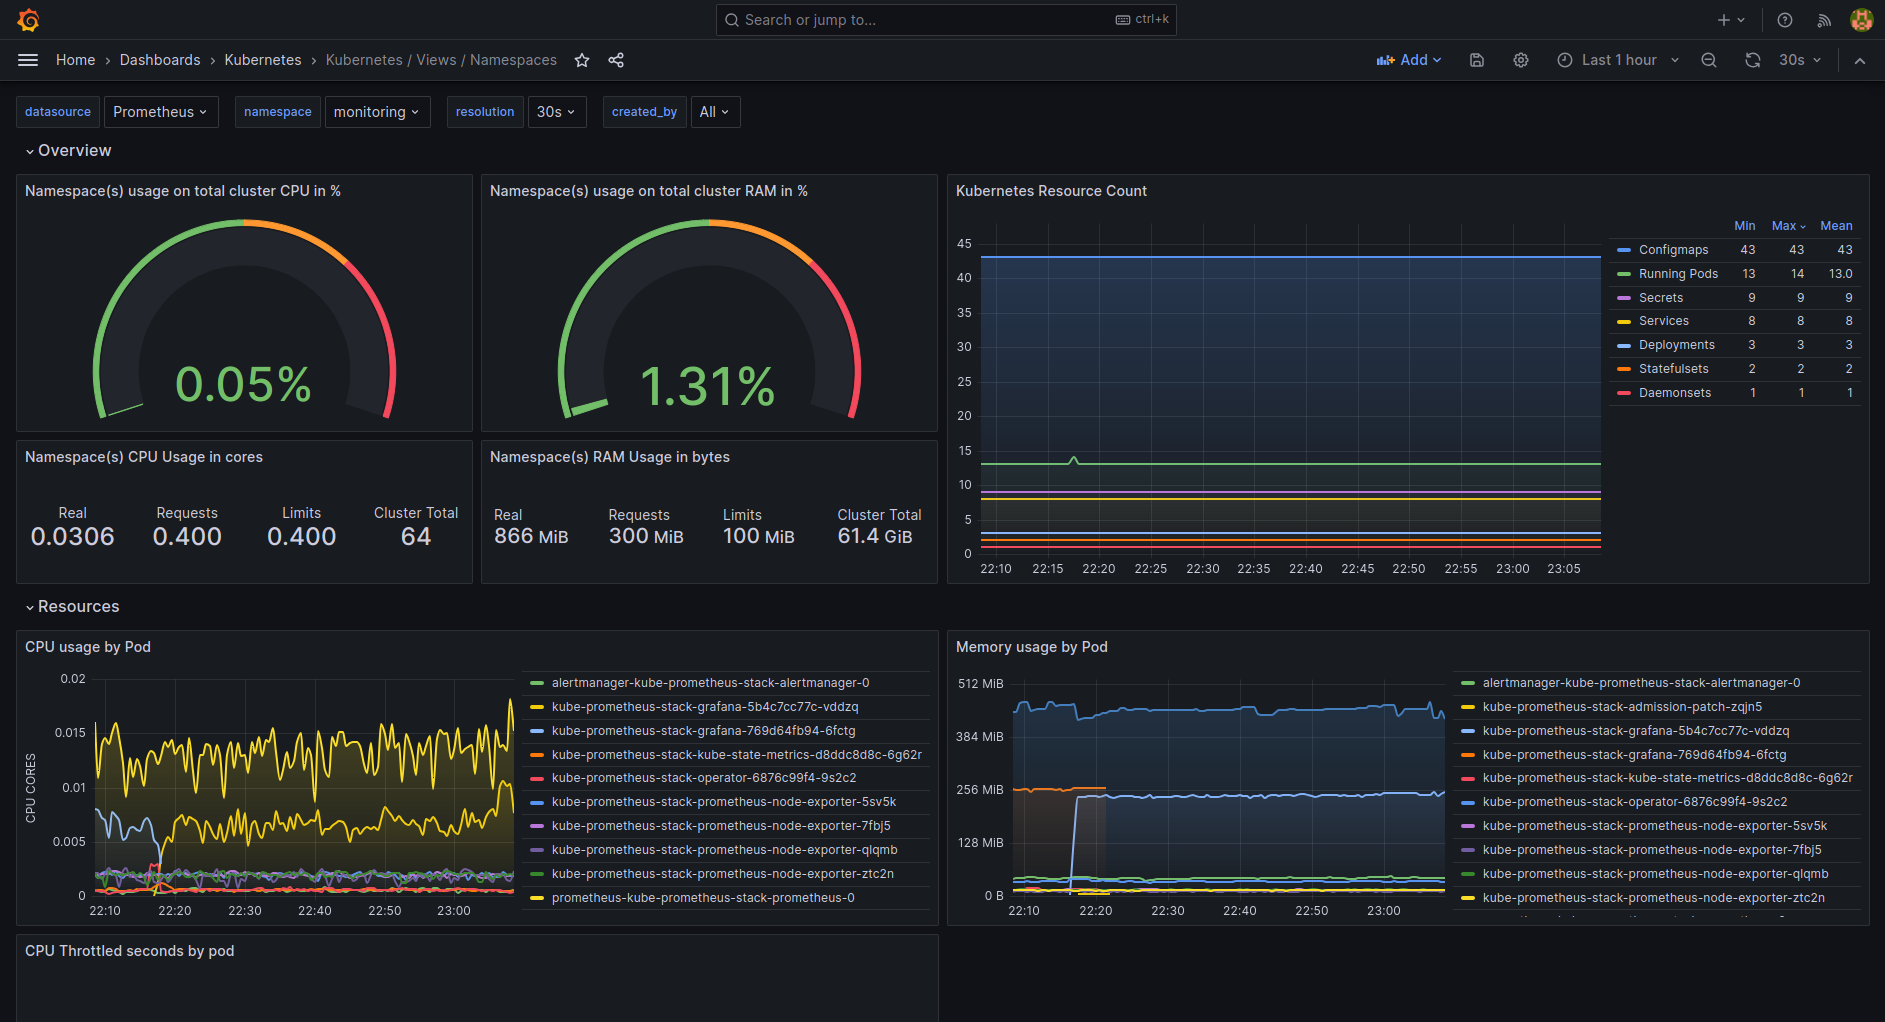
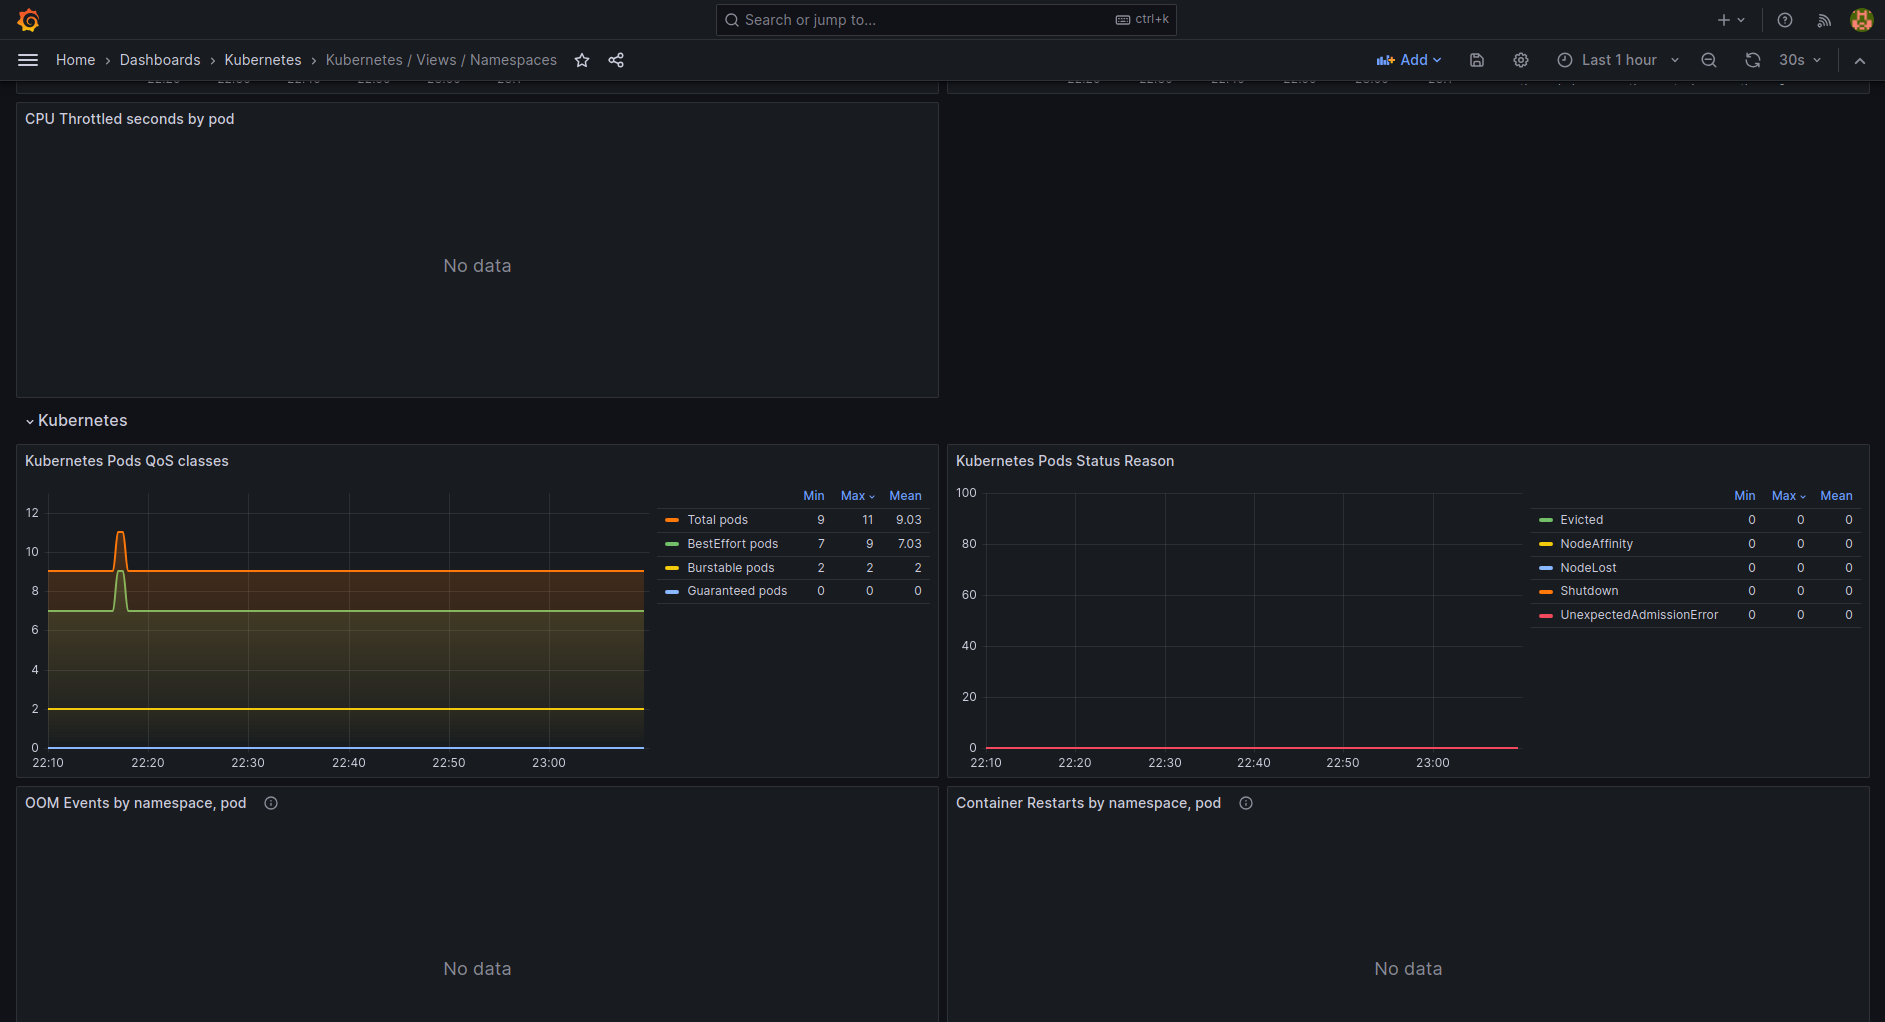
This dashboard provides a comprehensive view of Kubernetes namespace health and resource usage, combining cluster-wide and per-namespace metrics to monitor CPU, memory, and pod-level status. It highlights resource distribution across namespaces, per-pod CPU and memory usage, and deployment readiness with panels like container_cpu_usage_seconds_total, machine_cpu_cores, and container_memory_working_set_bytes to surface hotspots, capacity vs. consumption, and potential bottlenecks.
Screenshots

Used Metrics 4343
cluster
-
container_cpu_cfs_throttled_seconds_total
-
container_cpu_usage_seconds_total
-
container_memory_working_set_bytes
-
container_network_receive_bytes_total
-
container_network_receive_errors_total
-
container_network_receive_packets_dropped_total
-
container_network_receive_packets_total
-
container_network_transmit_bytes_total
-
container_network_transmit_errors_total
-
container_network_transmit_packets_dropped_total
-
container_network_transmit_packets_total
-
container_oom_events_total
kube_configmap_info
kube_daemonset_labels
kube_deployment_labels
kube_deployment_status_replicas_available
kube_deployment_status_replicas_unavailable
kube_hpa_labels
kube_ingress_info
kube_networkpolicy_labels
kube_persistentvolumeclaim_info
kube_pod_container_info
kube_pod_container_resource_limits
kube_pod_container_resource_requests
kube_pod_container_status_ready
kube_pod_container_status_restarts_total
kube_pod_container_status_running
kube_pod_container_status_terminated
kube_pod_container_status_waiting
kube_pod_info
kube_pod_status_phase
kube_pod_status_qos_class
kube_pod_status_reason
kube_secret_info
kube_service_info
kube_statefulset_labels
kubelet_volume_stats_capacity_bytes
kubelet_volume_stats_inodes
kubelet_volume_stats_inodes_used
kubelet_volume_stats_used_bytes
-
machine_cpu_cores
-
machine_memory_bytes