Kubernetes / Views / Global 7,221,1197,221,119 5.0 (4 reviews)
Description
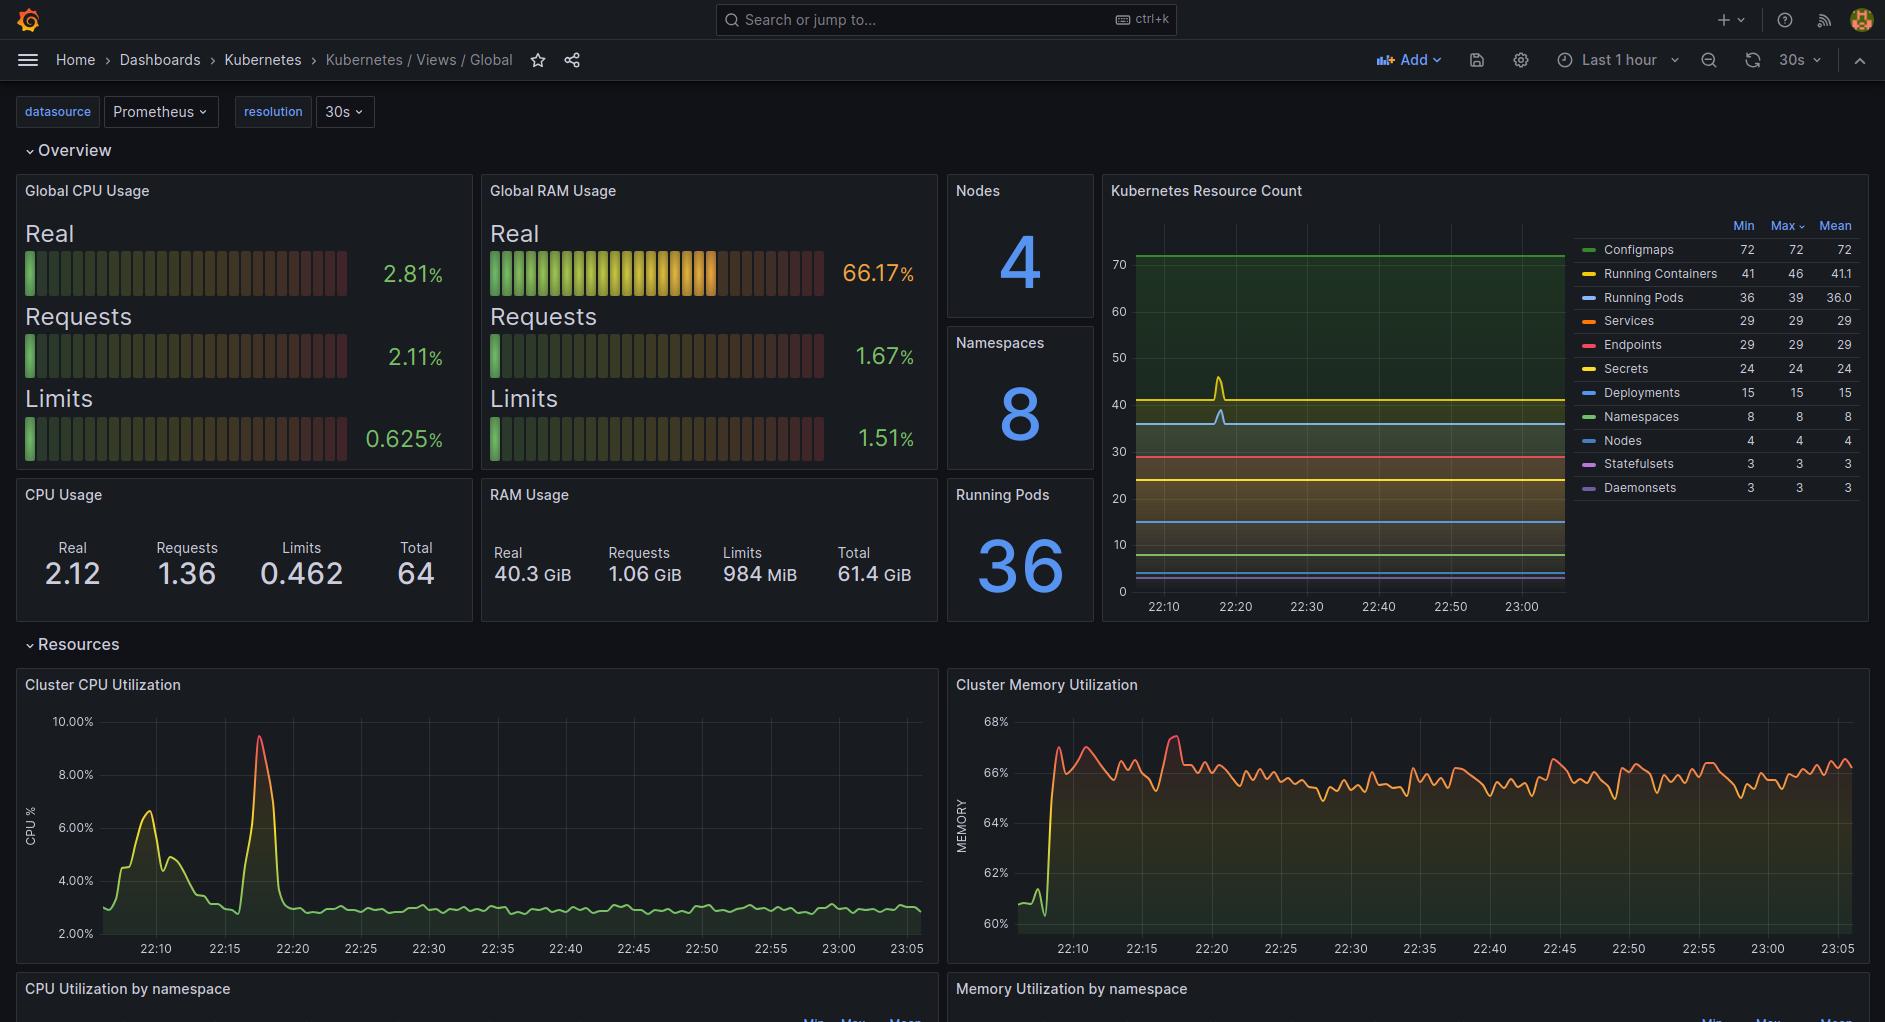
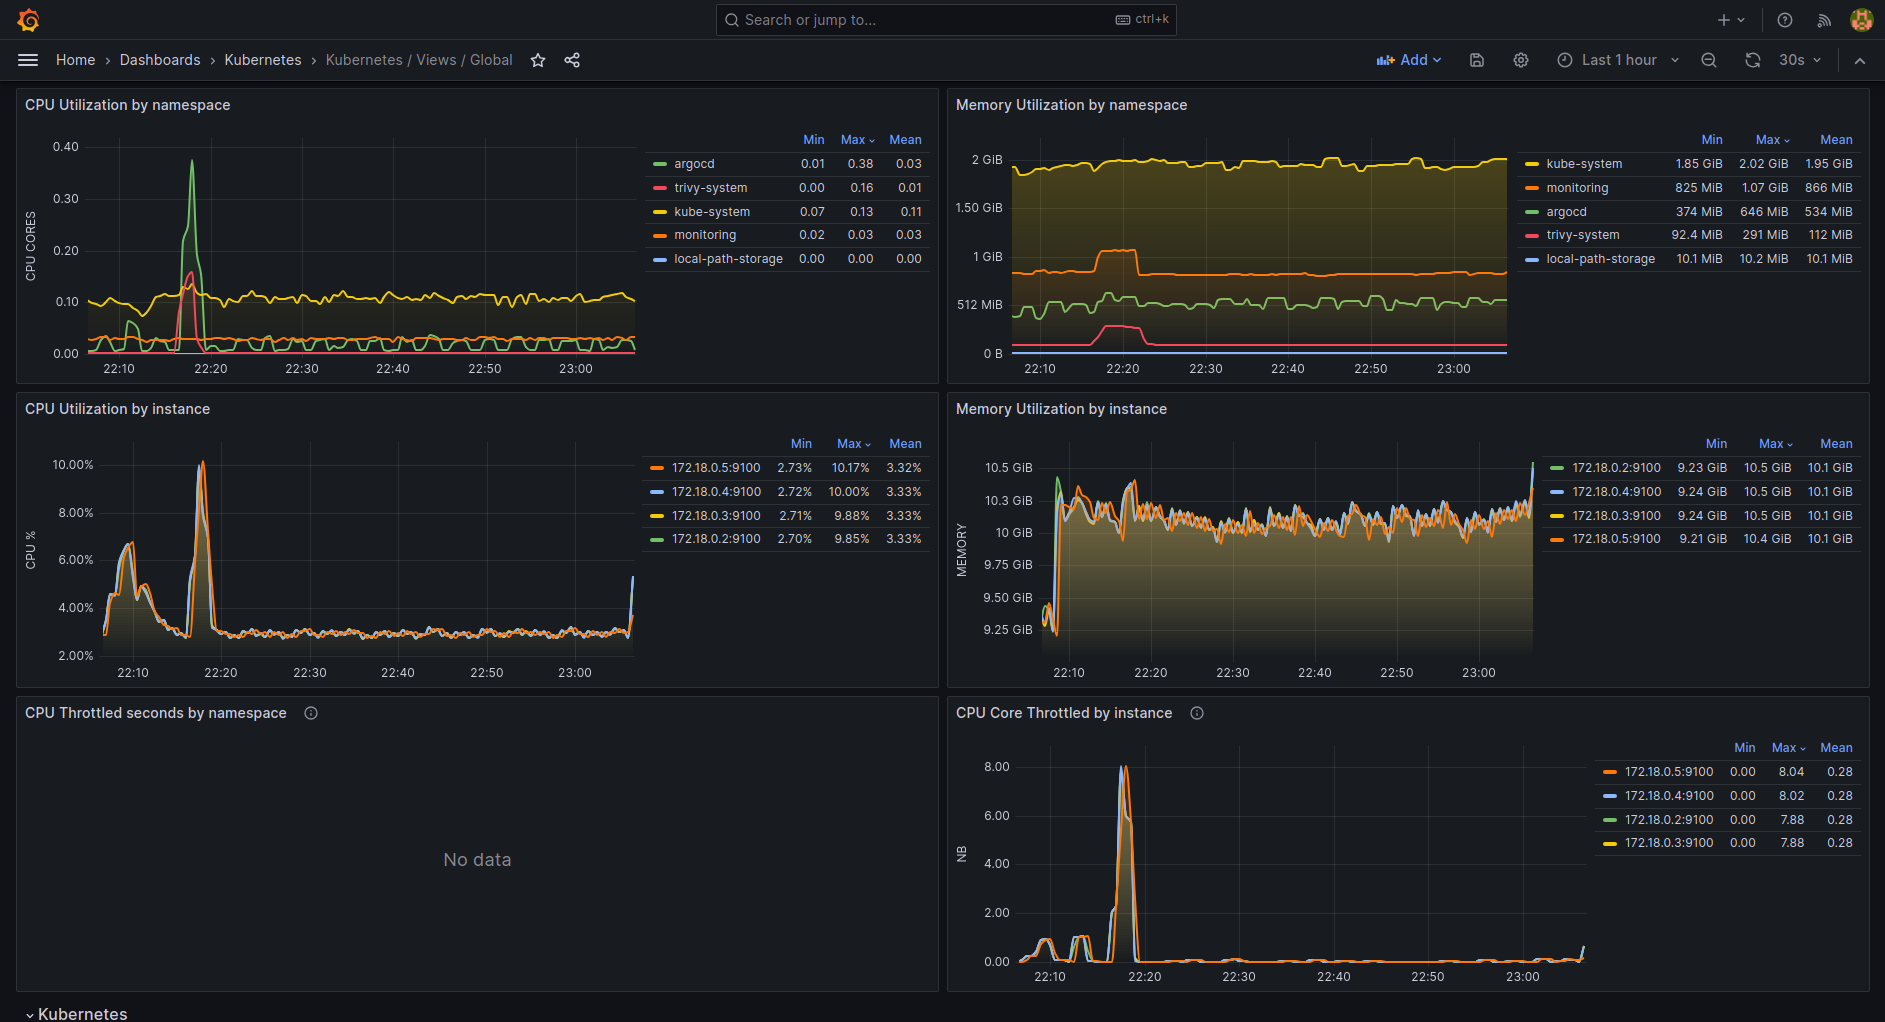
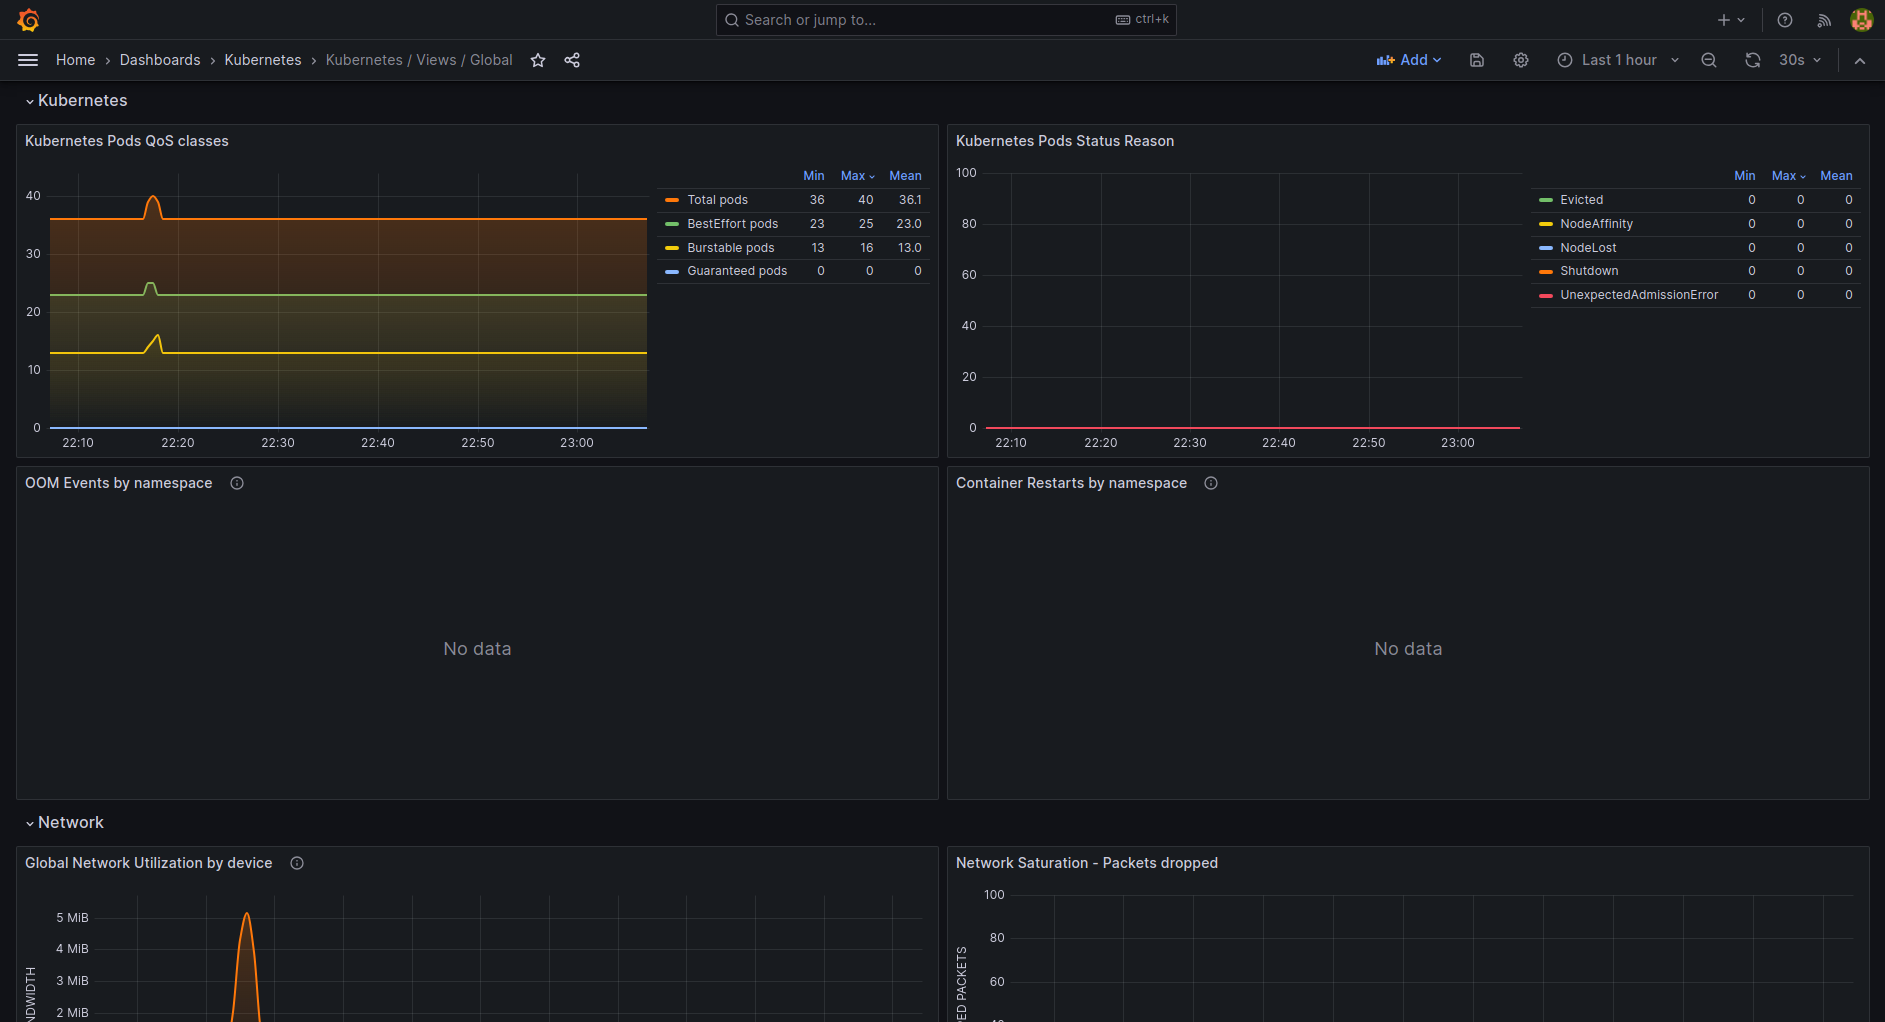
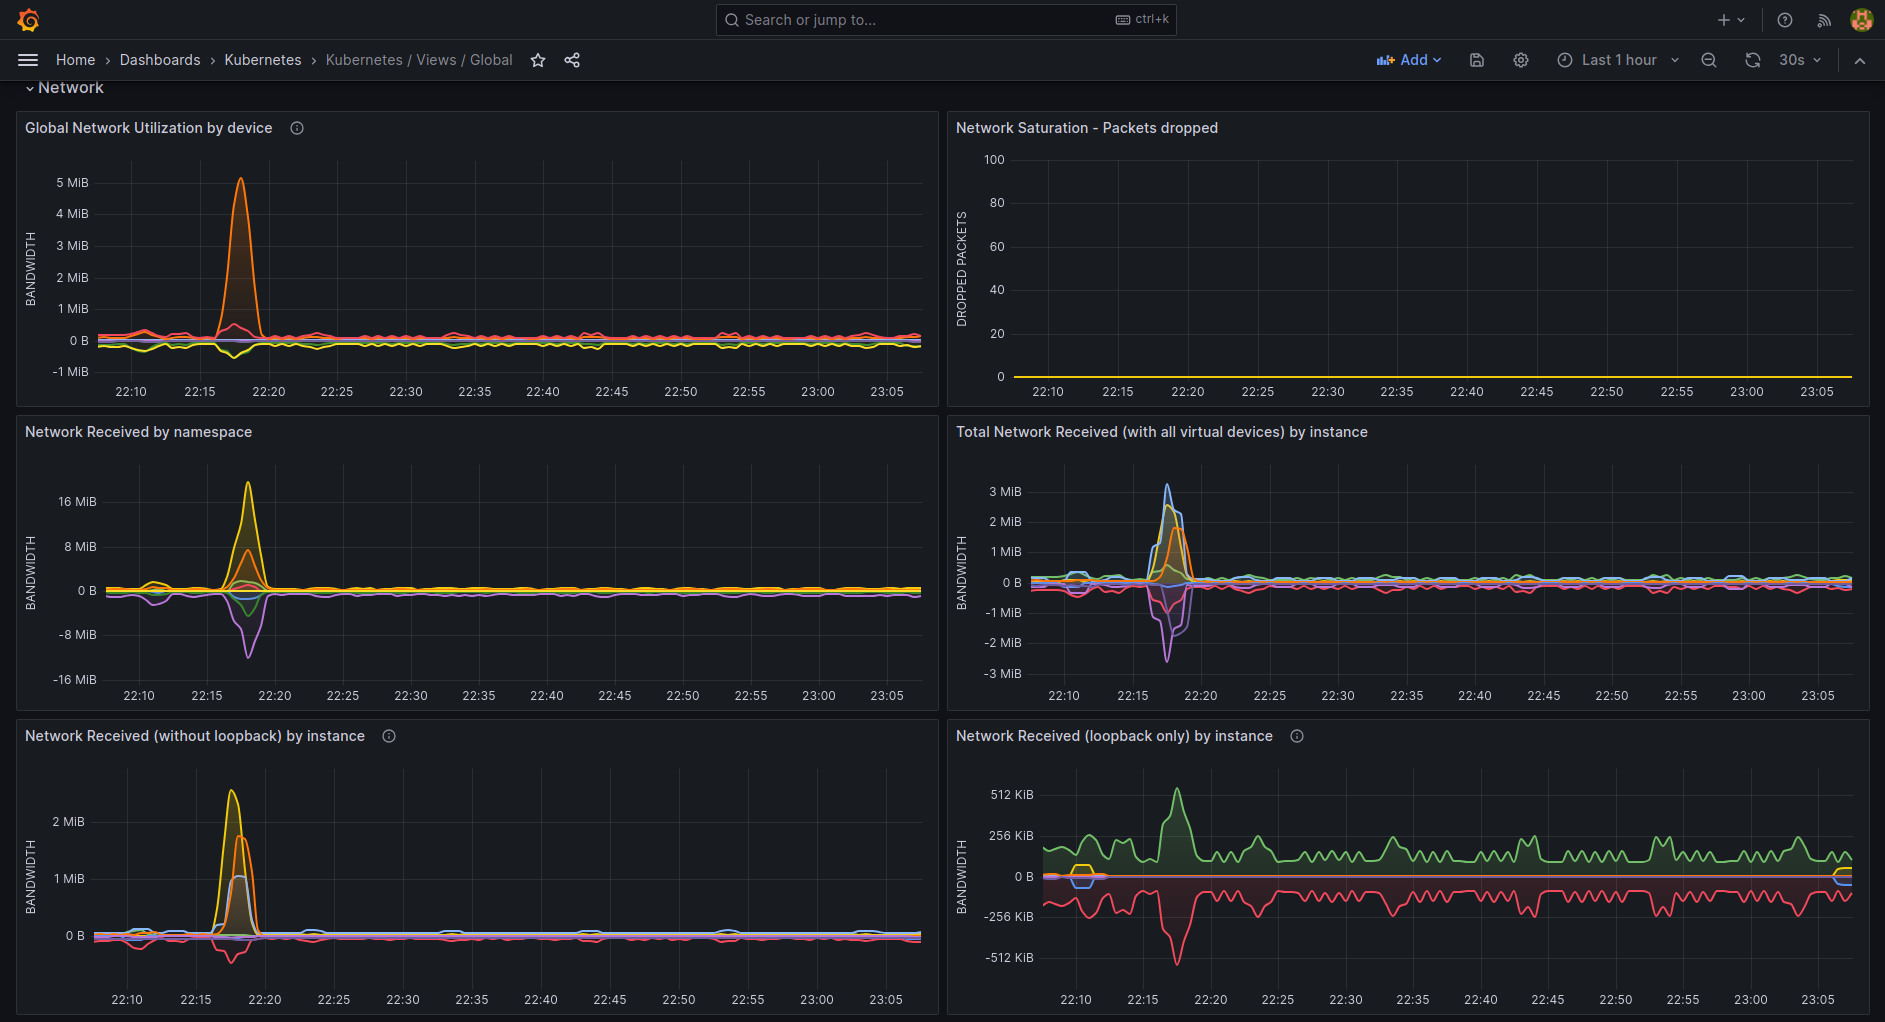
The dashboard provides a comprehensive, at-a-glance view of Kubernetes cluster health and resource utilization across the entire environment. It combines node-level metrics like node_cpu_seconds_total, node_memory_MemTotal_bytes, and node_memory_MemAvailable_bytes with cluster-wide dimensions such as CPU/RAM utilization, pod status, and QoS classifications to surface bottlenecks and capacity risks. Key features include per-namespace and per-instance utilization panels (e.g., CPU Utilization by namespace, Memory Utilization by instance), cluster utilization dashboards (e.g., Cluster CPU Utilization, Cluster Memory Utilization), and operational indicators for container lifecycle events and throttling (e.g., CPU Throttled seconds by namespace, Container Restarts by namespace, OOM Events by namespace).
Screenshots
Used Metrics 5454
container
-
container_cpu_cfs_throttled_seconds_total
-
container_cpu_usage_seconds_total
-
container_memory_working_set_bytes
-
container_network_receive_bytes_total
-
container_network_transmit_bytes_total
-
container_oom_events_total
kube_configmap_info
kube_daemonset_labels
kube_deployment_labels
kube_endpoint_info
kube_hpa_labels
kube_ingress_info
kube_namespace_created
kube_namespace_labels
kube_networkpolicy_labels
kube_node_info
kube_persistentvolumeclaim_info
kube_pod_container_info
kube_pod_container_resource_limits
kube_pod_container_resource_requests
kube_pod_container_status_restarts_total
kube_pod_container_status_running
kube_pod_info
kube_pod_status_phase
kube_pod_status_qos_class
kube_pod_status_reason
kube_secret_info
kube_service_info
kube_statefulset_labels
-
machine_cpu_cores
-
machine_memory_bytes
namespace
node_cpu_core_throttles_total
-
node_cpu_seconds_total
-
node_memory_MemAvailable_bytes
-
node_memory_MemTotal_bytes
-
node_network_receive_bytes_total
-
node_network_receive_drop_total
-
node_network_transmit_bytes_total
-
node_network_transmit_drop_total
pod
windows_container_cpu_usage_seconds_total
windows_container_memory_usage_commit_bytes
windows_container_network_receive_bytes_total
windows_container_network_transmit_bytes_total
windows_cpu_time_total
windows_memory_available_bytes
windows_memory_cache_bytes
windows_net_bytes_received_total
windows_net_bytes_sent_total
windows_net_packets_outbound_discarded_total
windows_net_packets_received_discarded_total
windows_os_visible_memory_bytes