Kubernetes资源利用率监控(via xiaoping378) 780780
10/9/2016
8/24/2017
1
Docker
>=3.1.1
Prometheus
Description
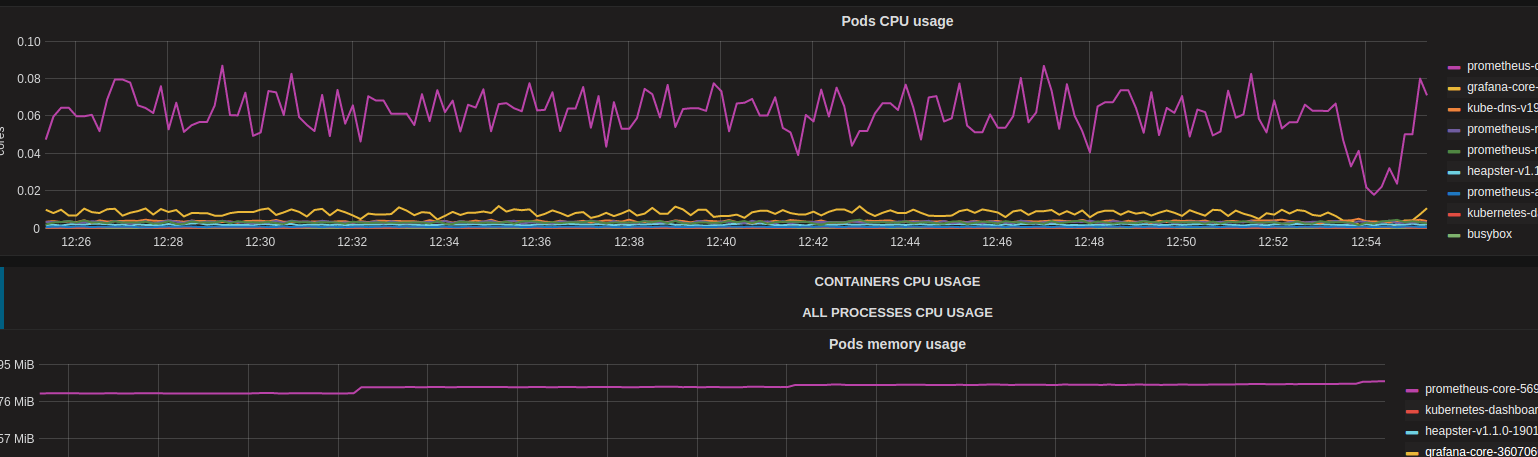
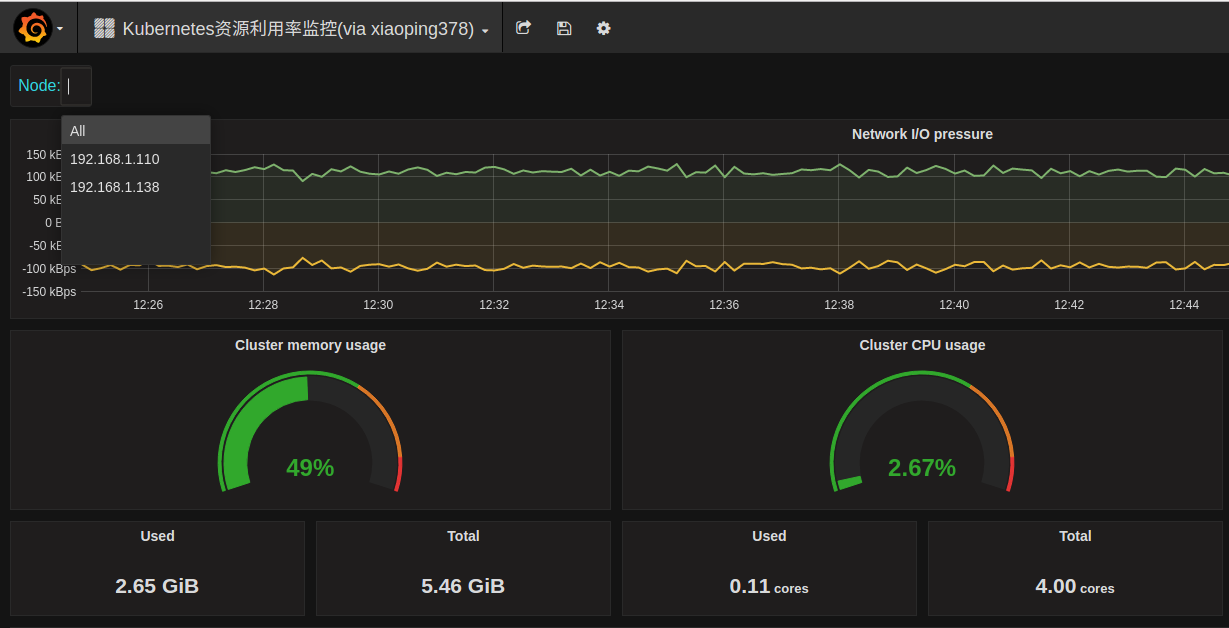
Monitors Kubernetes cluster using Prometheus. Shows overall cluster CPU / Memory / Filesystem usage as well as individual pod, containers, systemd services statistics. Uses cAdvisor metrics only.
Screenshots
Get Dashboard✕
Download
Copy to Clipboard