Kubernetes / System / API Server 5,659,3005,659,300 5.0 (2 reviews)
2/15/2022
11/1/2025
20
DockerHost Metrics
>=8.4.4
Prometheus
Description
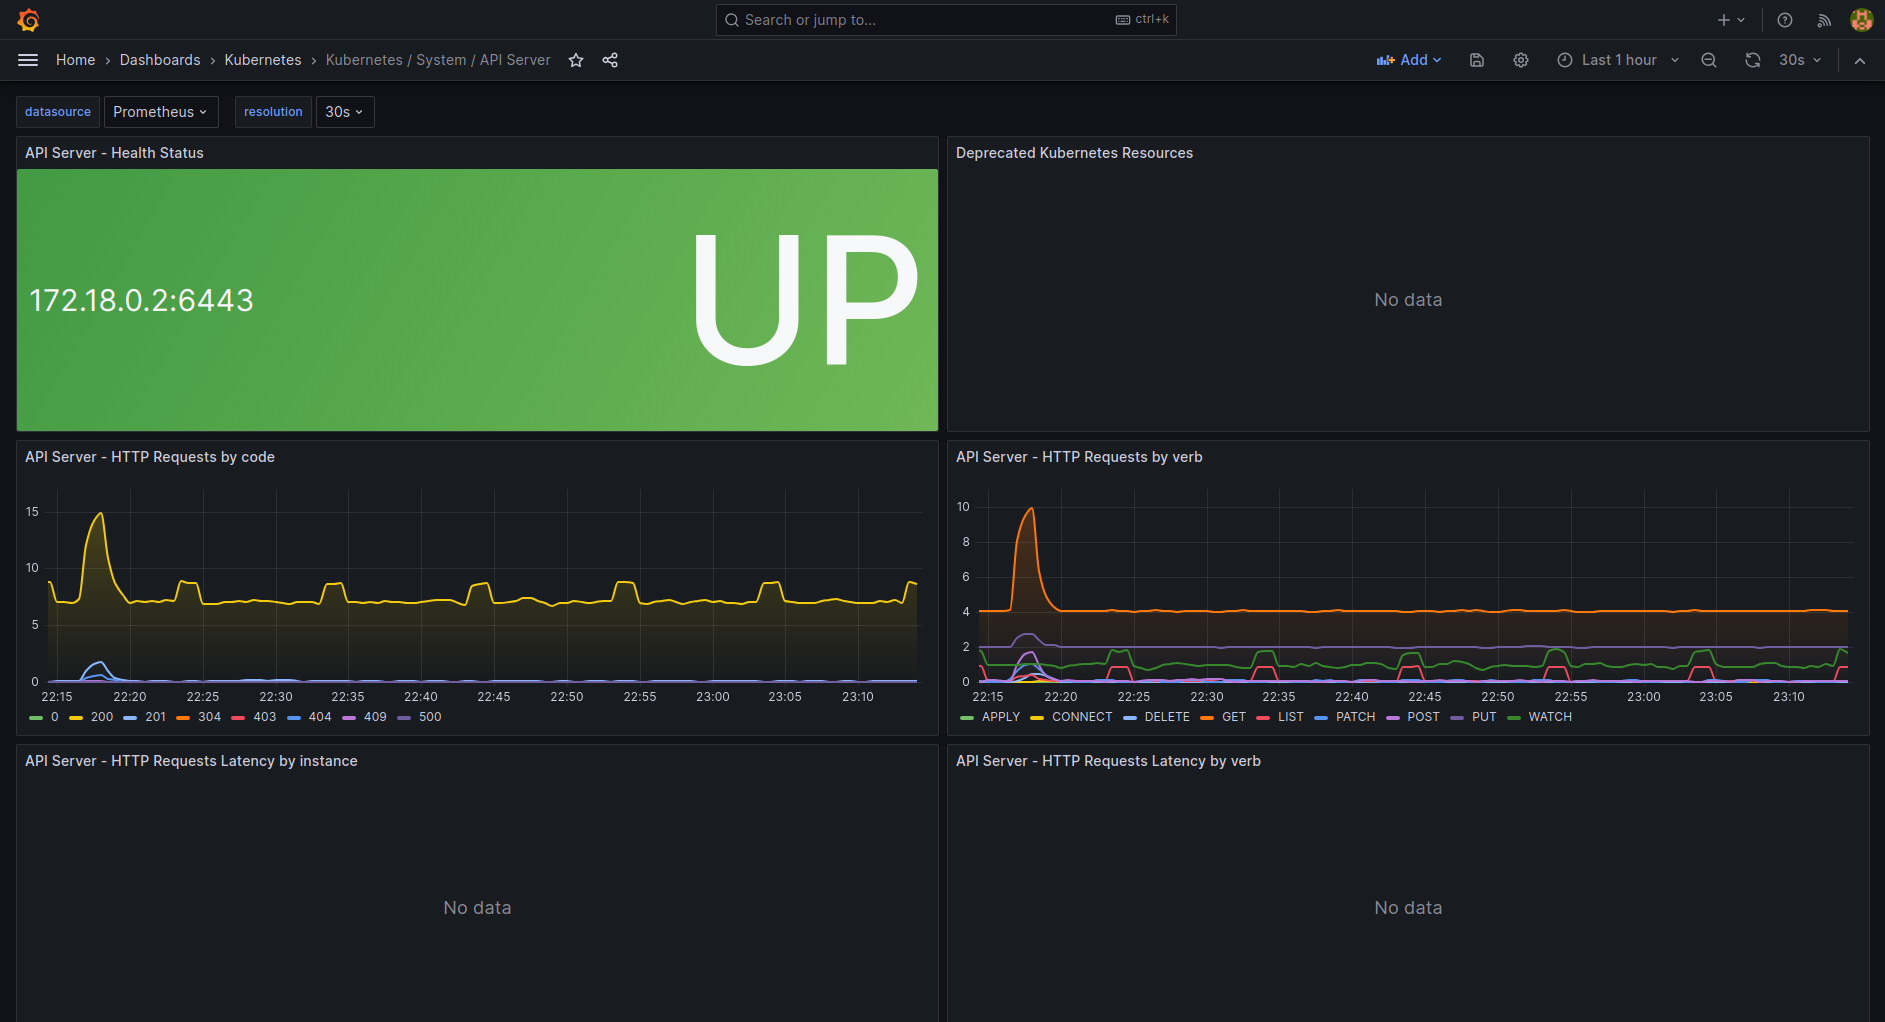
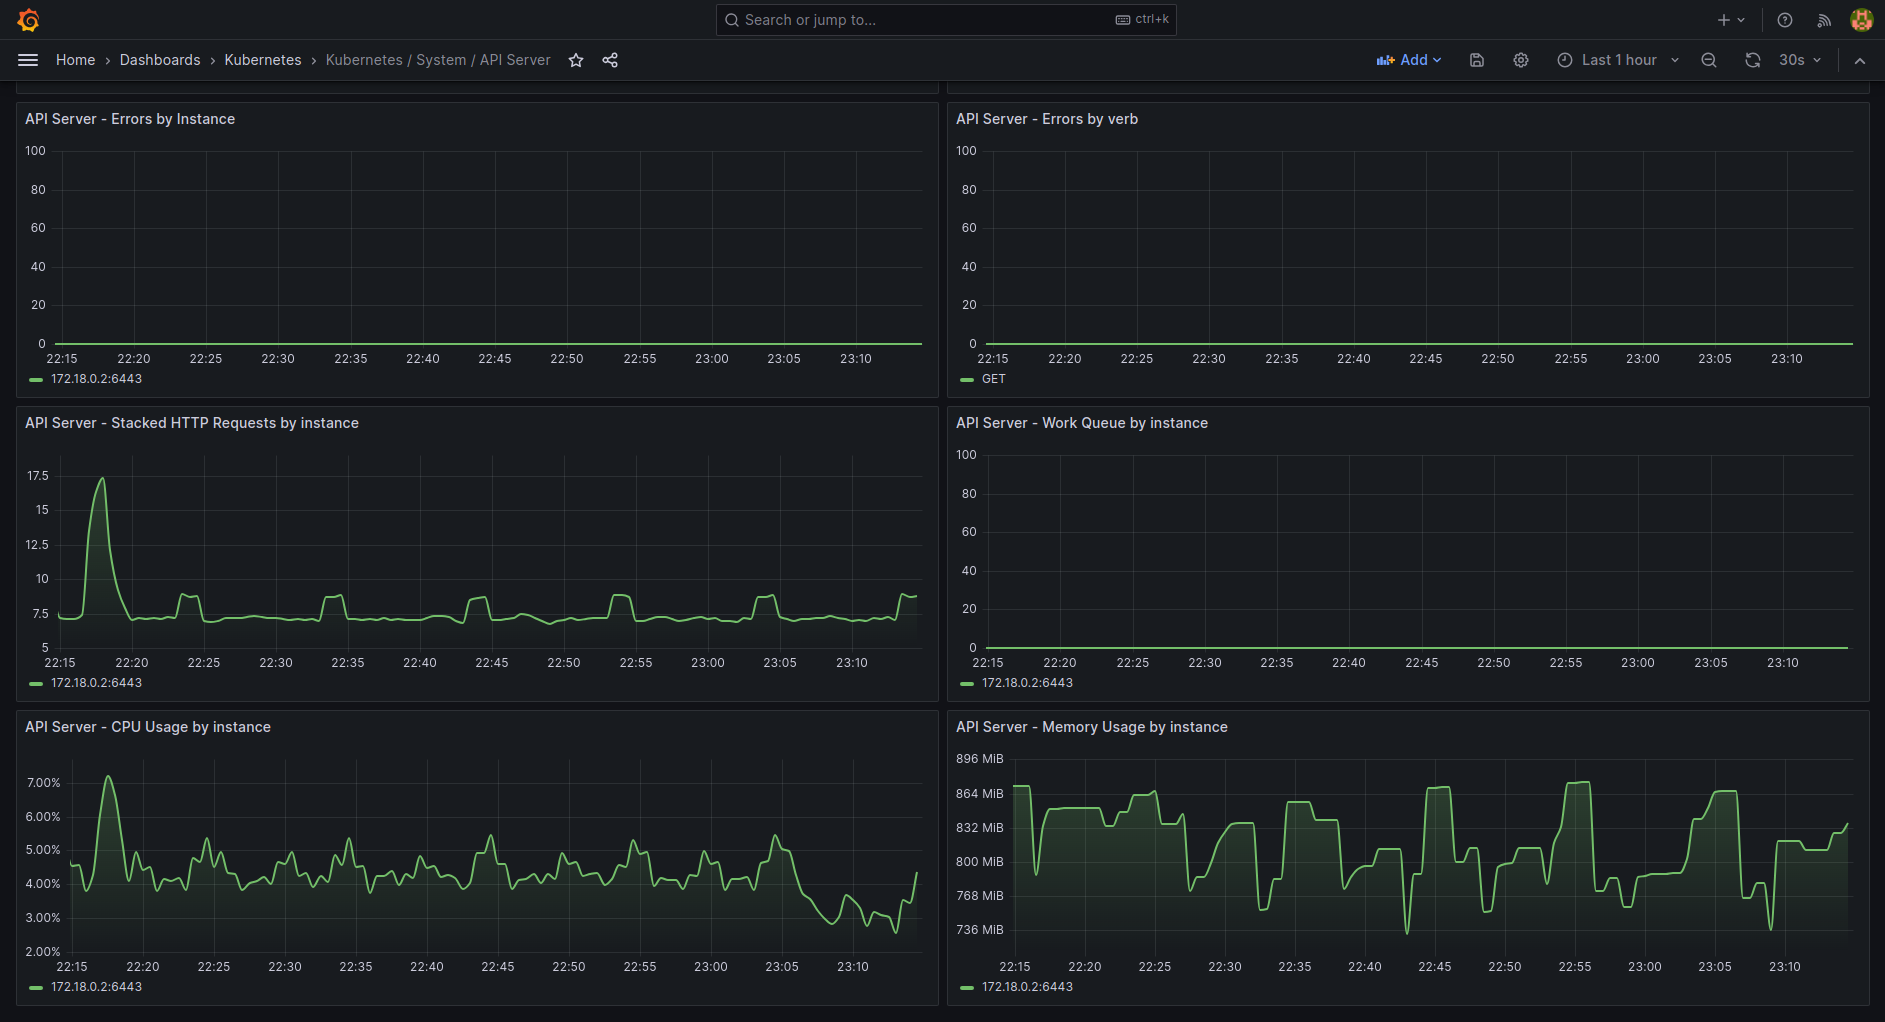
This dashboard monitors the health and performance of the Kubernetes API Server, aggregating requests, latency, errors, and resource usage across instances. It highlights HTTP request patterns with metrics like apiserver_request_total and apiserver_request_duration_seconds_sum/_count to compute latency, tracks errors by instance/verb, and surfaces system load through process_cpu_seconds_total and process_resident_memory_bytes alongside queue depth with workqueue_depth.
Screenshots
Used Metrics 88
apiserver_request_duration_seconds_count
apiserver_request_duration_seconds_sum
apiserver_request_total
apiserver_requested_deprecated_apis
-
process_cpu_seconds_total
-
process_resident_memory_bytes
-
up
workqueue_depth
Get Dashboard✕
Download
Copy to Clipboard