Kubernetes Resource Requests 9,889,5729,889,572
7/27/2018
7/27/2018
1
>=4.6.2
Prometheus
Description
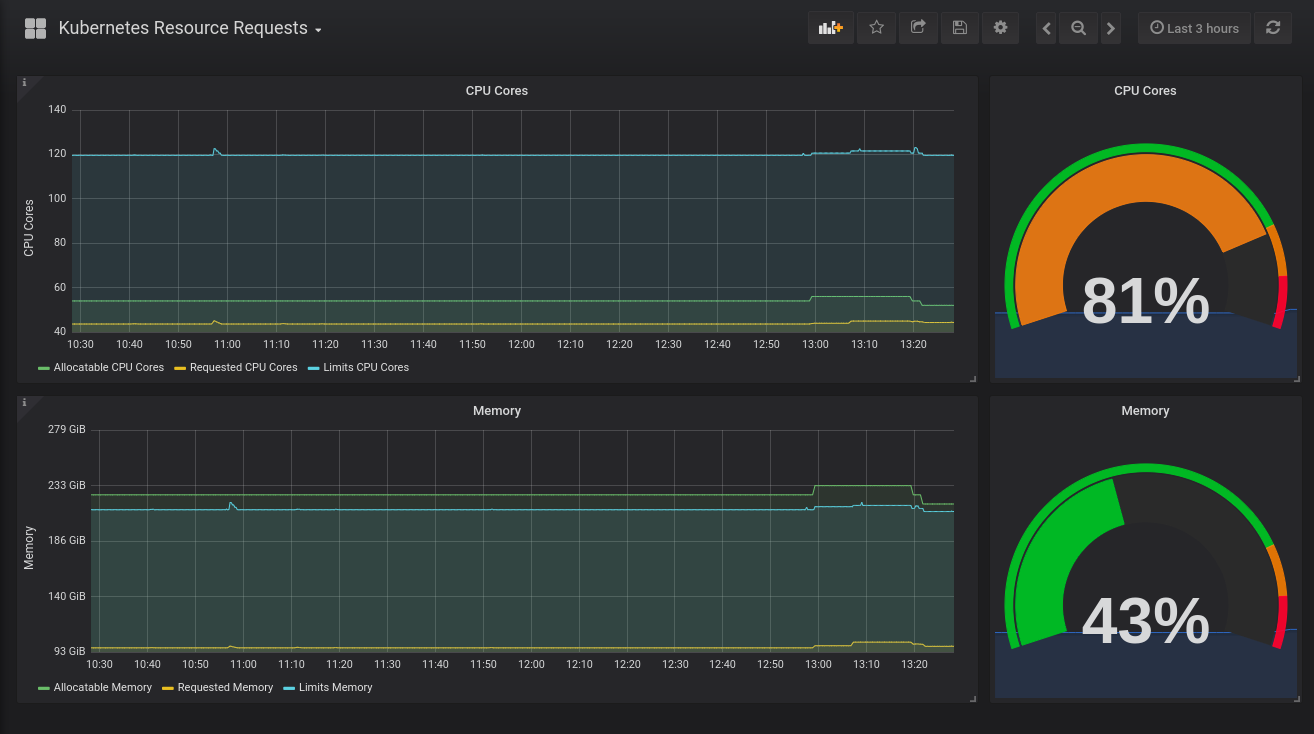
Monitors node and pod resource allocations to ensure workloads have sufficient CPU and memory headroom. It highlights allocatable vs requested/limited resources with panels like CPU Cores and Memory that track metrics such as kube_node_status_allocatable_cpu_cores, kube_pod_container_resource_requests_cpu_cores, and kube_pod_container_resource_limits_cpu_cores (and their memory equivalents) to identify overcommit, saturation, and potential bottlenecks across the cluster.
Screenshots
Used Metrics 66
kube_node_status_allocatable_cpu_cores
kube_node_status_allocatable_memory_bytes
kube_pod_container_resource_limits_cpu_cores
kube_pod_container_resource_limits_memory_bytes
kube_pod_container_resource_requests_cpu_cores
kube_pod_container_resource_requests_memory_bytes
Get Dashboard✕
Download
Copy to Clipboard