Kubernetes Pods (Prometheus) 226,955226,955 5.0 (1 reviews)
Description
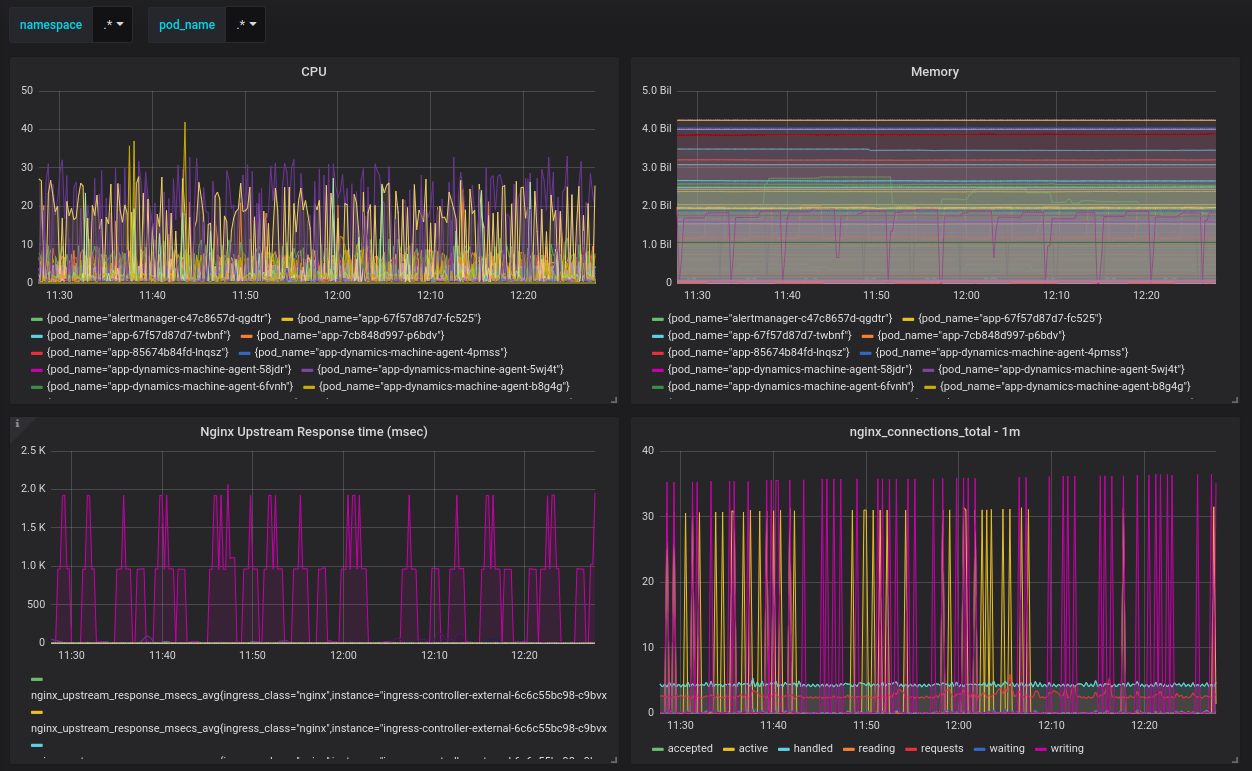
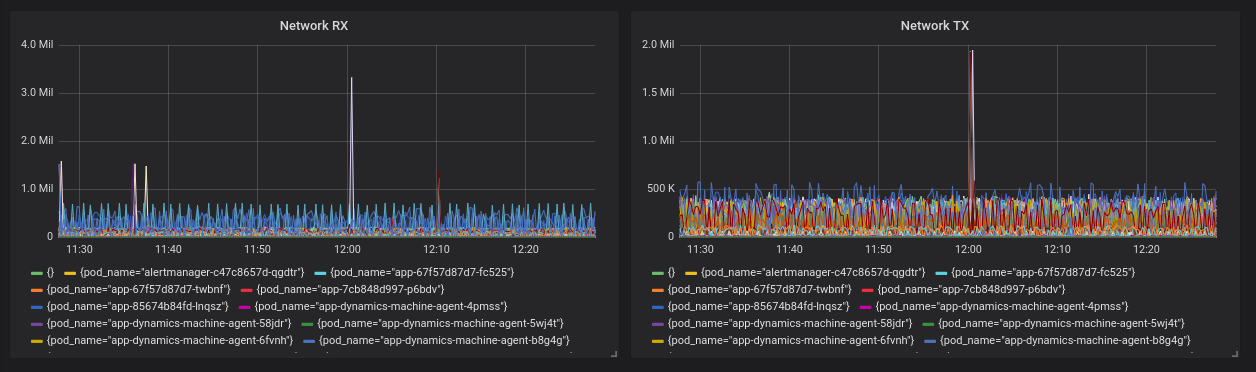
This dashboard monitors Kubernetes pod performance by aggregating Prometheus metrics such as container_cpu_usage_seconds_total, container_memory_working_set_bytes, and nginx_upstream_response_msecs_avg to reveal CPU utilization, memory footprint, and request latency across pods. It features panels for network I/O and connection metrics like container_network_receive_bytes_total, container_network_transmit_bytes_total, and nginx_connections_total, enabling real-time insight into throughput, latency, and connection activity with concise time-range analyses.
Screenshots
Used Metrics 66
-
container_cpu_usage_seconds_total
-
container_memory_working_set_bytes
-
container_network_receive_bytes_total
-
container_network_transmit_bytes_total
nginx_connections_total
nginx_upstream_response_msecs_avg