
Kubernetes Pod Metrics 11,271,04711,271,047 3.0 (1 reviews)
10/25/2016
10/26/2016
2
>=3.1.0
Prometheus
Description
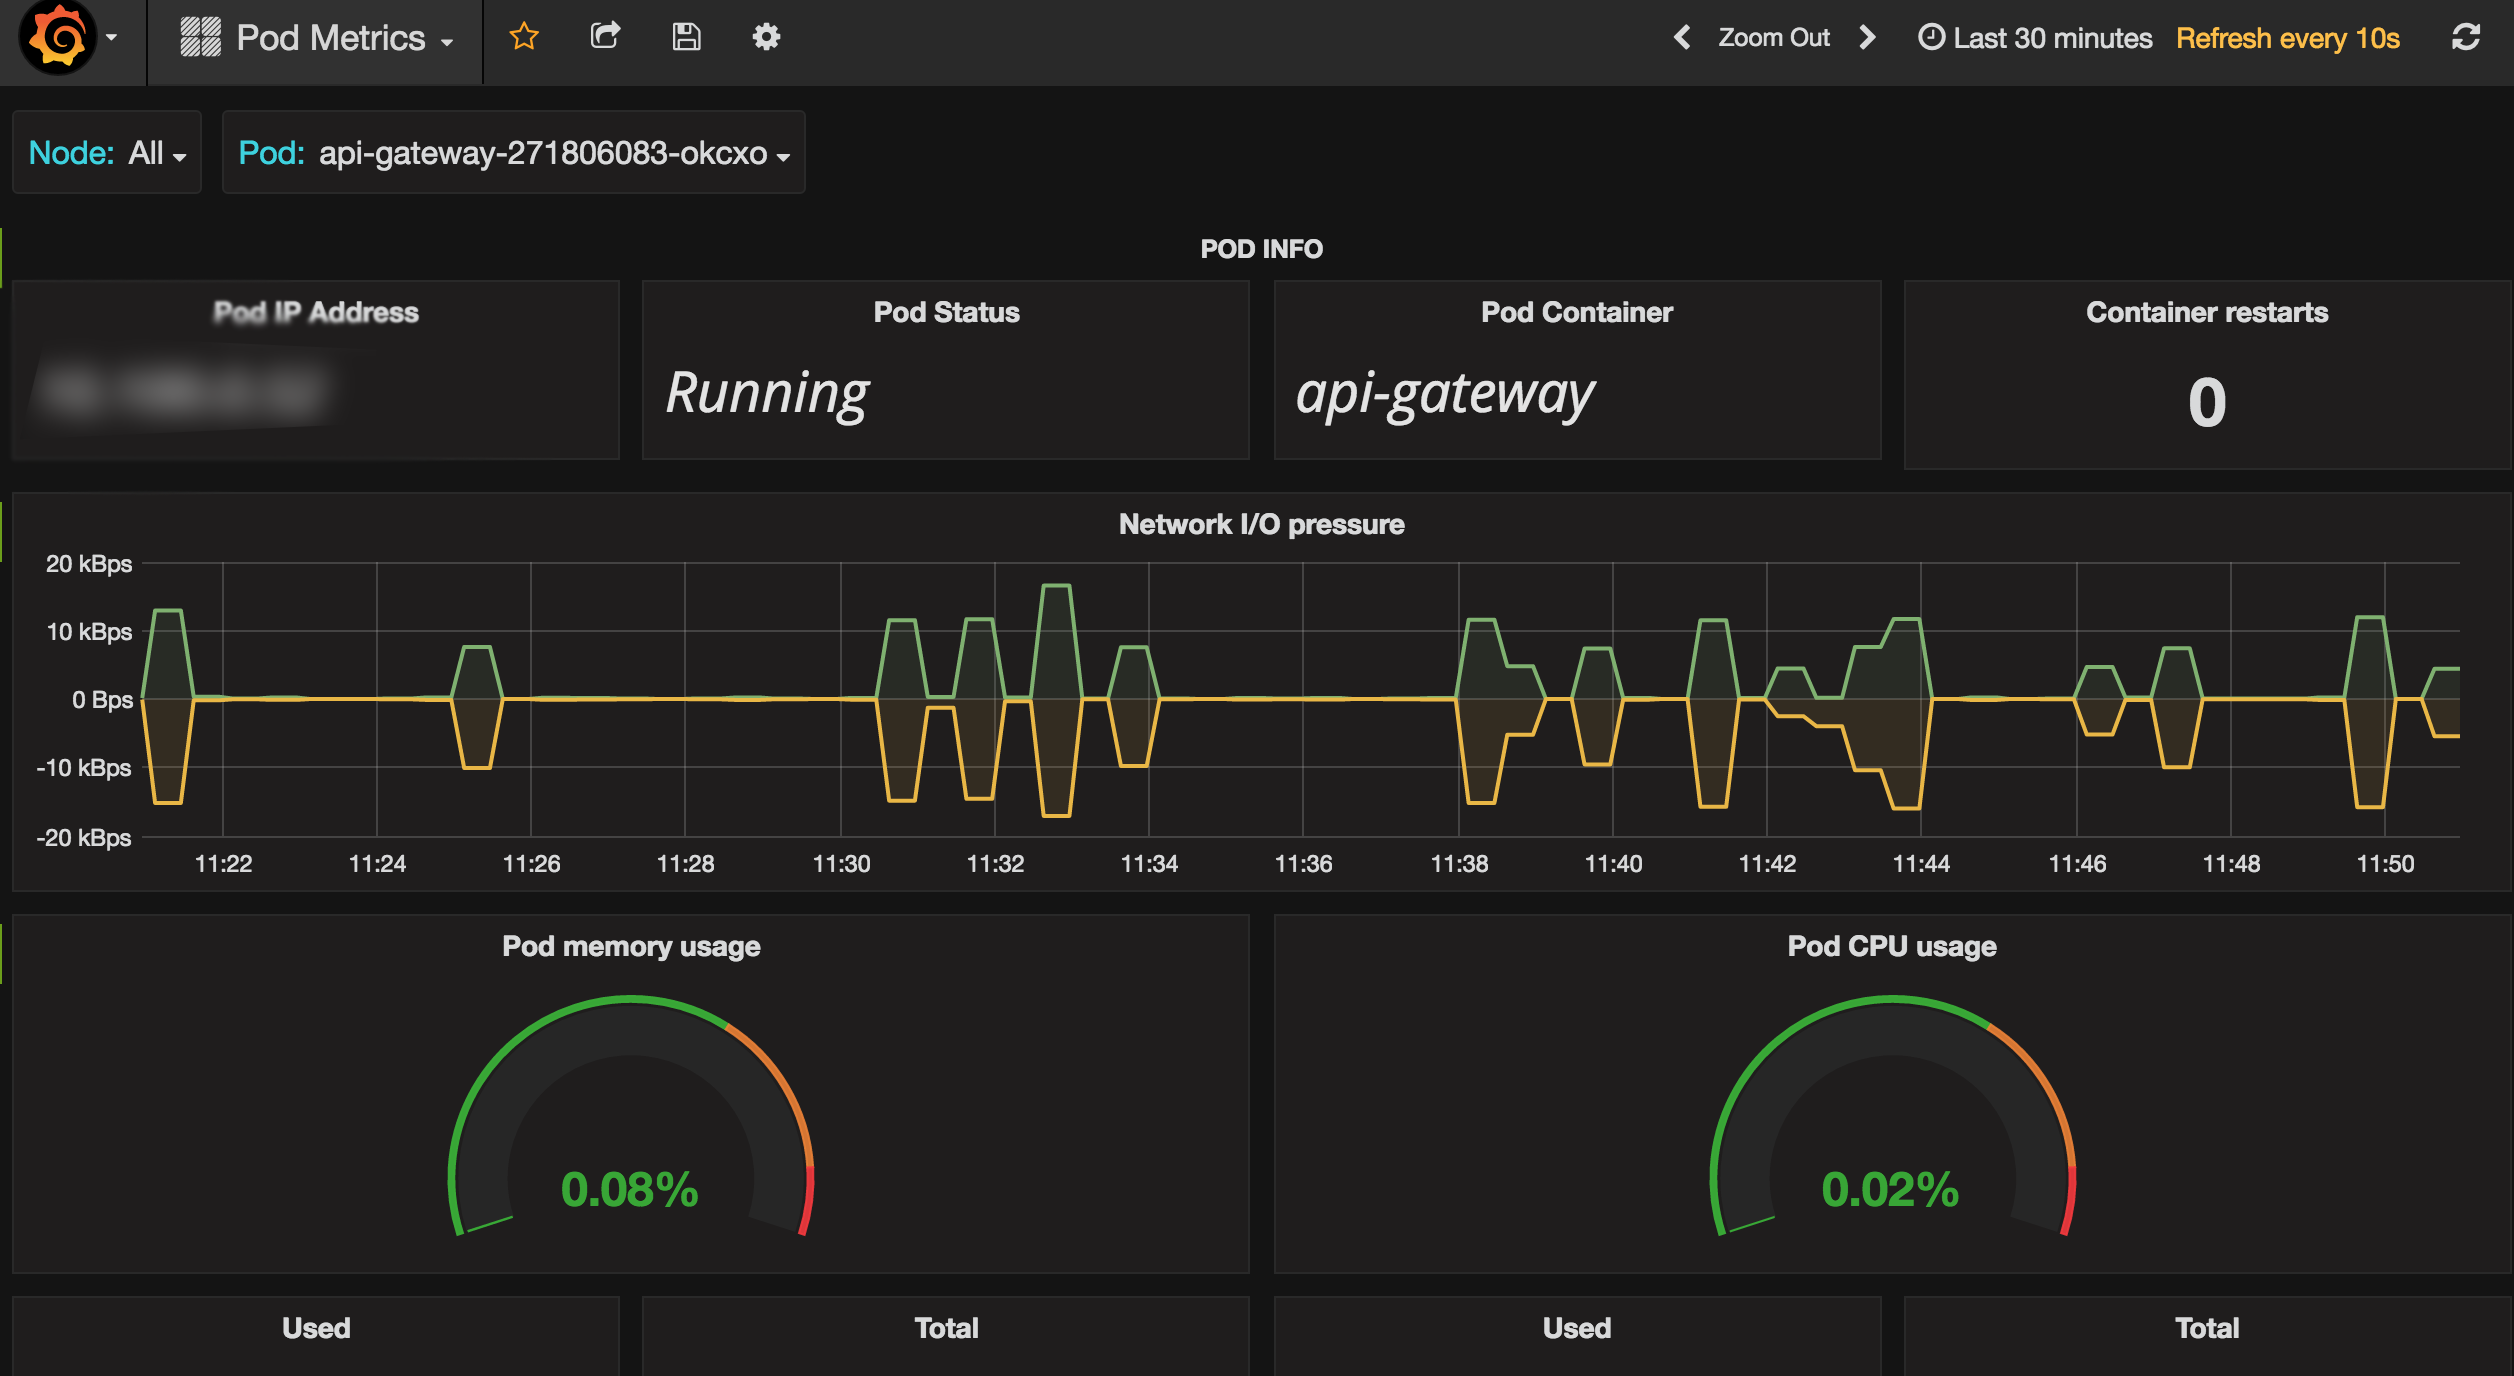
Monitors pod-level performance and health in a Kubernetes cluster by aggregating core runtime metrics. Key metrics include container_cpu_usage_seconds_total, container_memory_usage_bytes, and container_network_receive_bytes_total, which are typically surfaced per-pod and can be sliced by namespace, pod, and container to identify CPU pressure, memory pressure, and network activity. The dashboard likely includes time-series panels with alerts and heatmaps to highlight anomalous resource usage and pod restarts, with consistent units and unit dropdowns for easy comparison across namespaces.
Screenshots
Get Dashboard✕
Download
Copy to Clipboard