Kubernetes pod and cluster monitoring (via Prometheus) 150,293150,293
Description
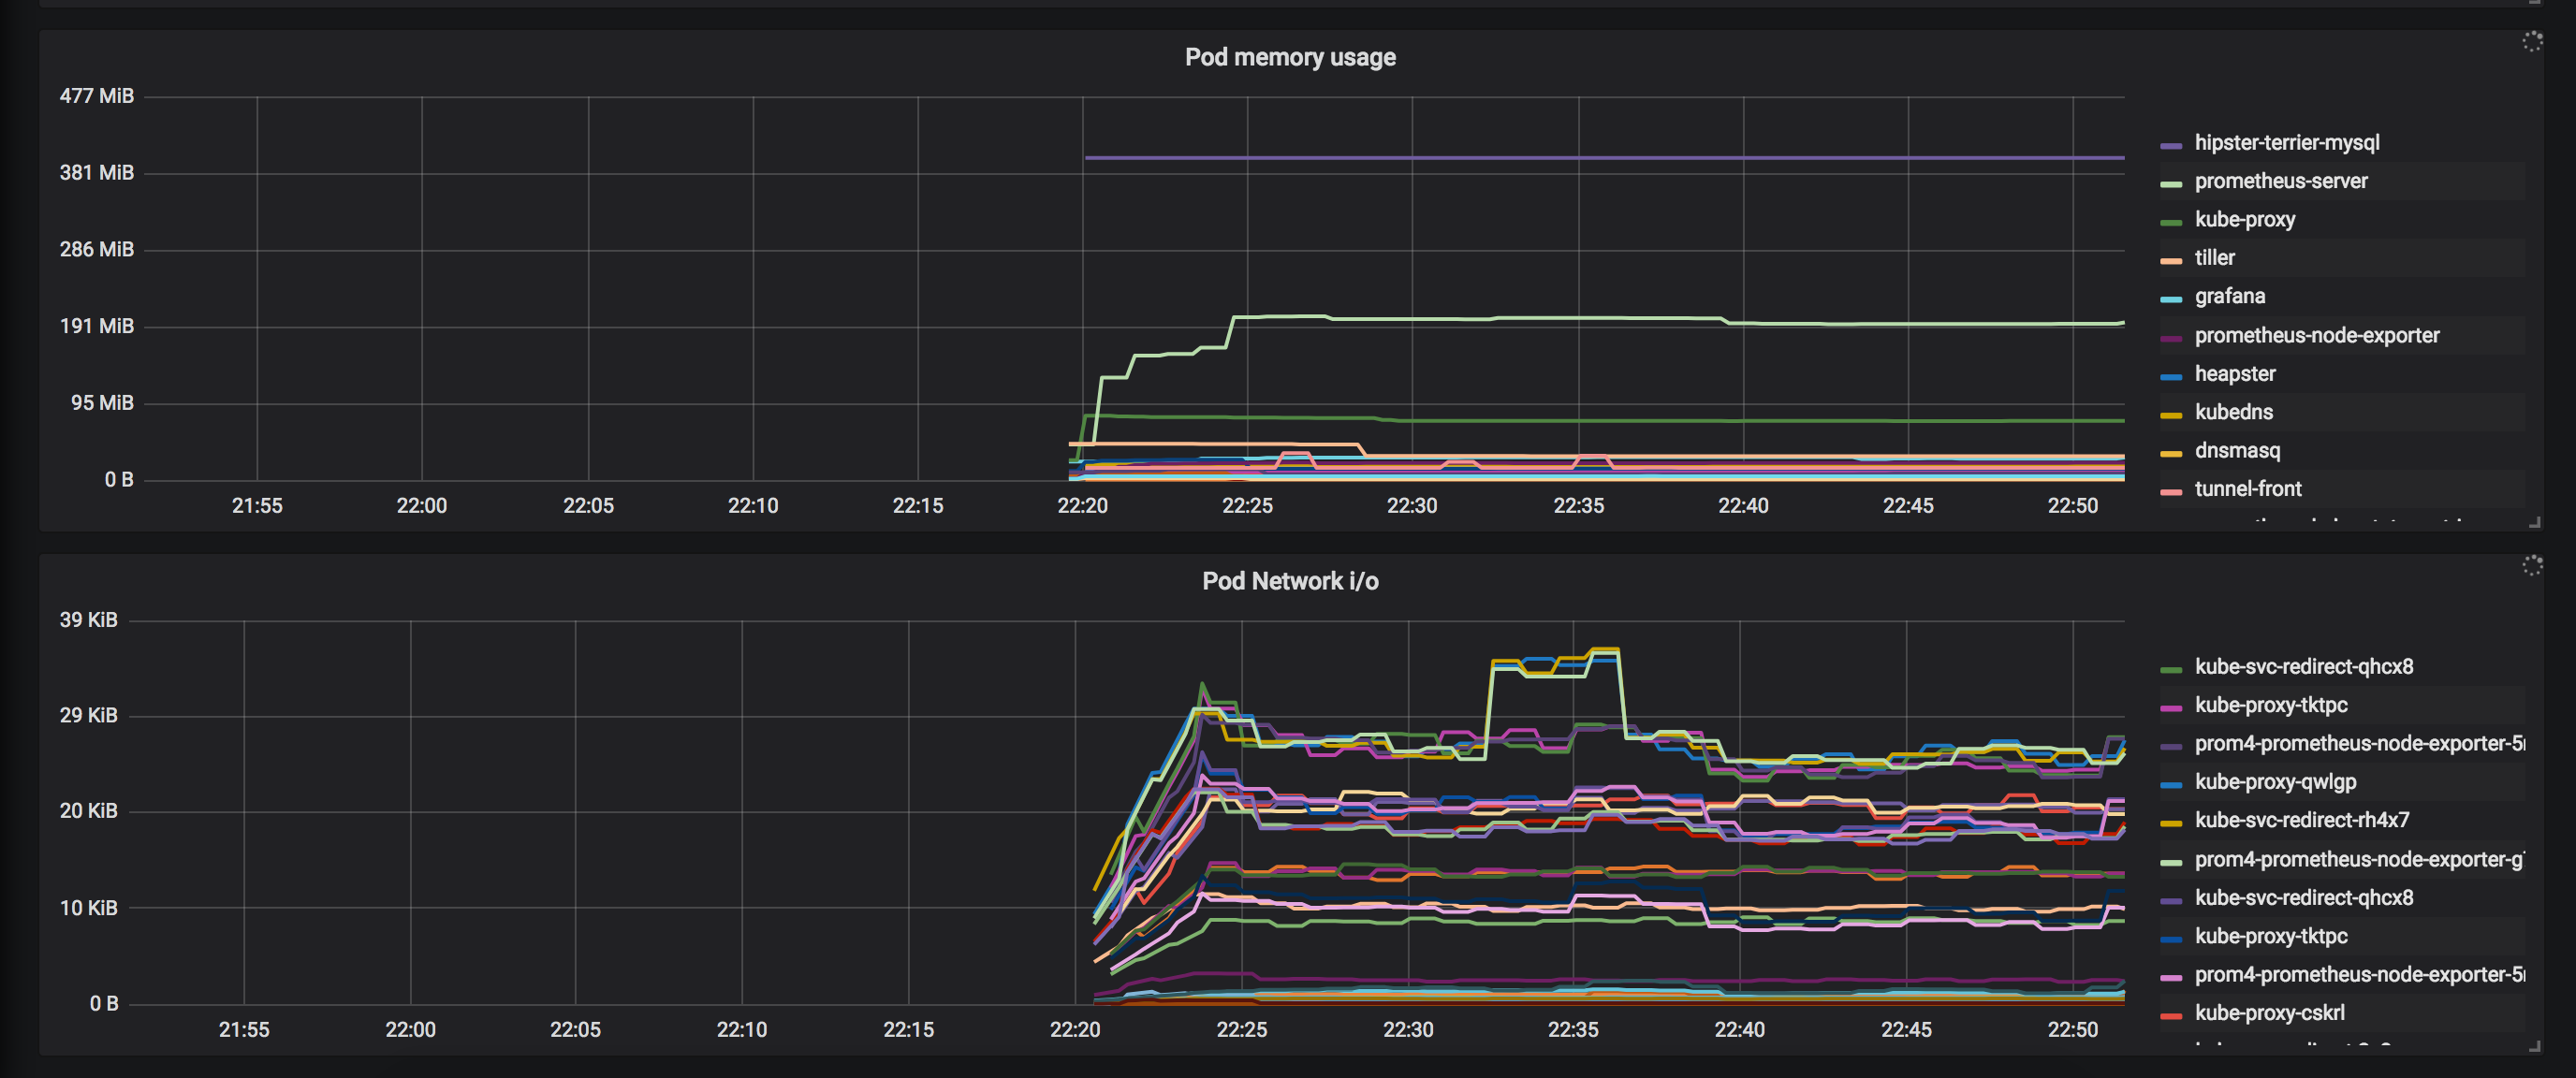
This dashboard provides a consolidated view of Kubernetes resource utilization by querying Prometheus metrics for both cluster-level and per-pod workloads. It highlights core resources such as CPU, memory, and filesystem/network I/O, with key panels like Cluster CPU usage, Pod CPU usage, and Pod memory usage to compare node assets (node_cpu, node_memory_MemTotal, node_memory_MemFree) against container-level metrics (container_cpu_usage_seconds_total, container_memory_usage_bytes). It emphasizes actionable visibility into pod-level performance and cluster capacity, enabling quick detection of saturation, bottlenecks, and overcommitment.
Screenshots
Used Metrics 1111
-
container_cpu_usage_seconds_total
-
container_memory_usage_bytes
-
container_network_receive_bytes_total
-
container_network_transmit_bytes_total
node_cpu
node_filesystem_free
node_filesystem_size
node_memory_Buffers
node_memory_Cached
node_memory_MemFree
node_memory_MemTotal