Kubernetes Nodes 20,907,84520,907,845 5.0 (1 reviews)
Description
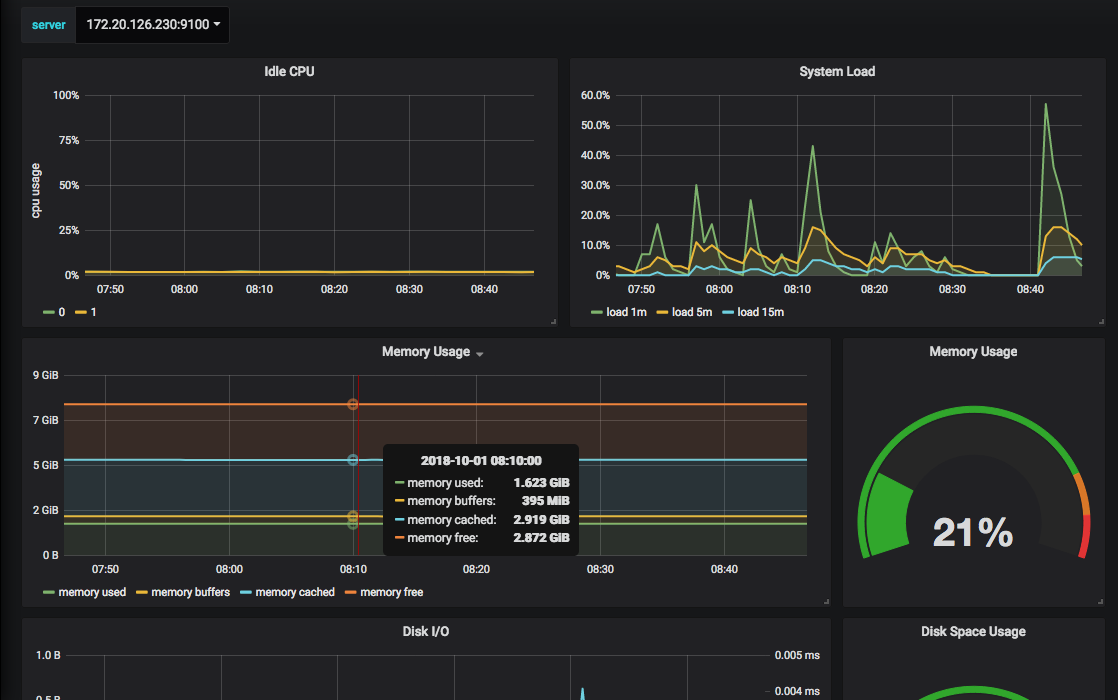
This dashboard monitors the health and resource usage of Kubernetes nodes by aggregating core system metrics across CPU, memory, disk, and network activity. It highlights central metrics like node_cpu_seconds_total (CPU utilization) and memory availability through values such as node_memory_MemTotal_bytes vs. node_memory_MemFree_bytes to indicate free headroom, while panels for System Load, Disk I/O, Disk Space Usage, and Network I/O provide a holistic view of capacity and throughput across the cluster.
Screenshots
Used Metrics 1515
-
node_cpu_seconds_total
-
node_disk_io_time_seconds_total
-
node_filesystem_free_bytes
-
node_filesystem_size_bytes
-
node_load1
-
node_load15
-
node_load5
-
node_memory_Buffers_bytes
-
node_memory_Cached_bytes
-
node_memory_MemFree_bytes
-
node_memory_MemTotal_bytes
-
node_network_receive_bytes_total
-
node_network_transmit_bytes_total
-
node_nfsd_disk_bytes_read_total
-
node_nfsd_disk_bytes_written_total