Kubernetes Nginx Ingress Prometheus NextGen 1,516,4201,516,420 5.0 (5 reviews)
Description
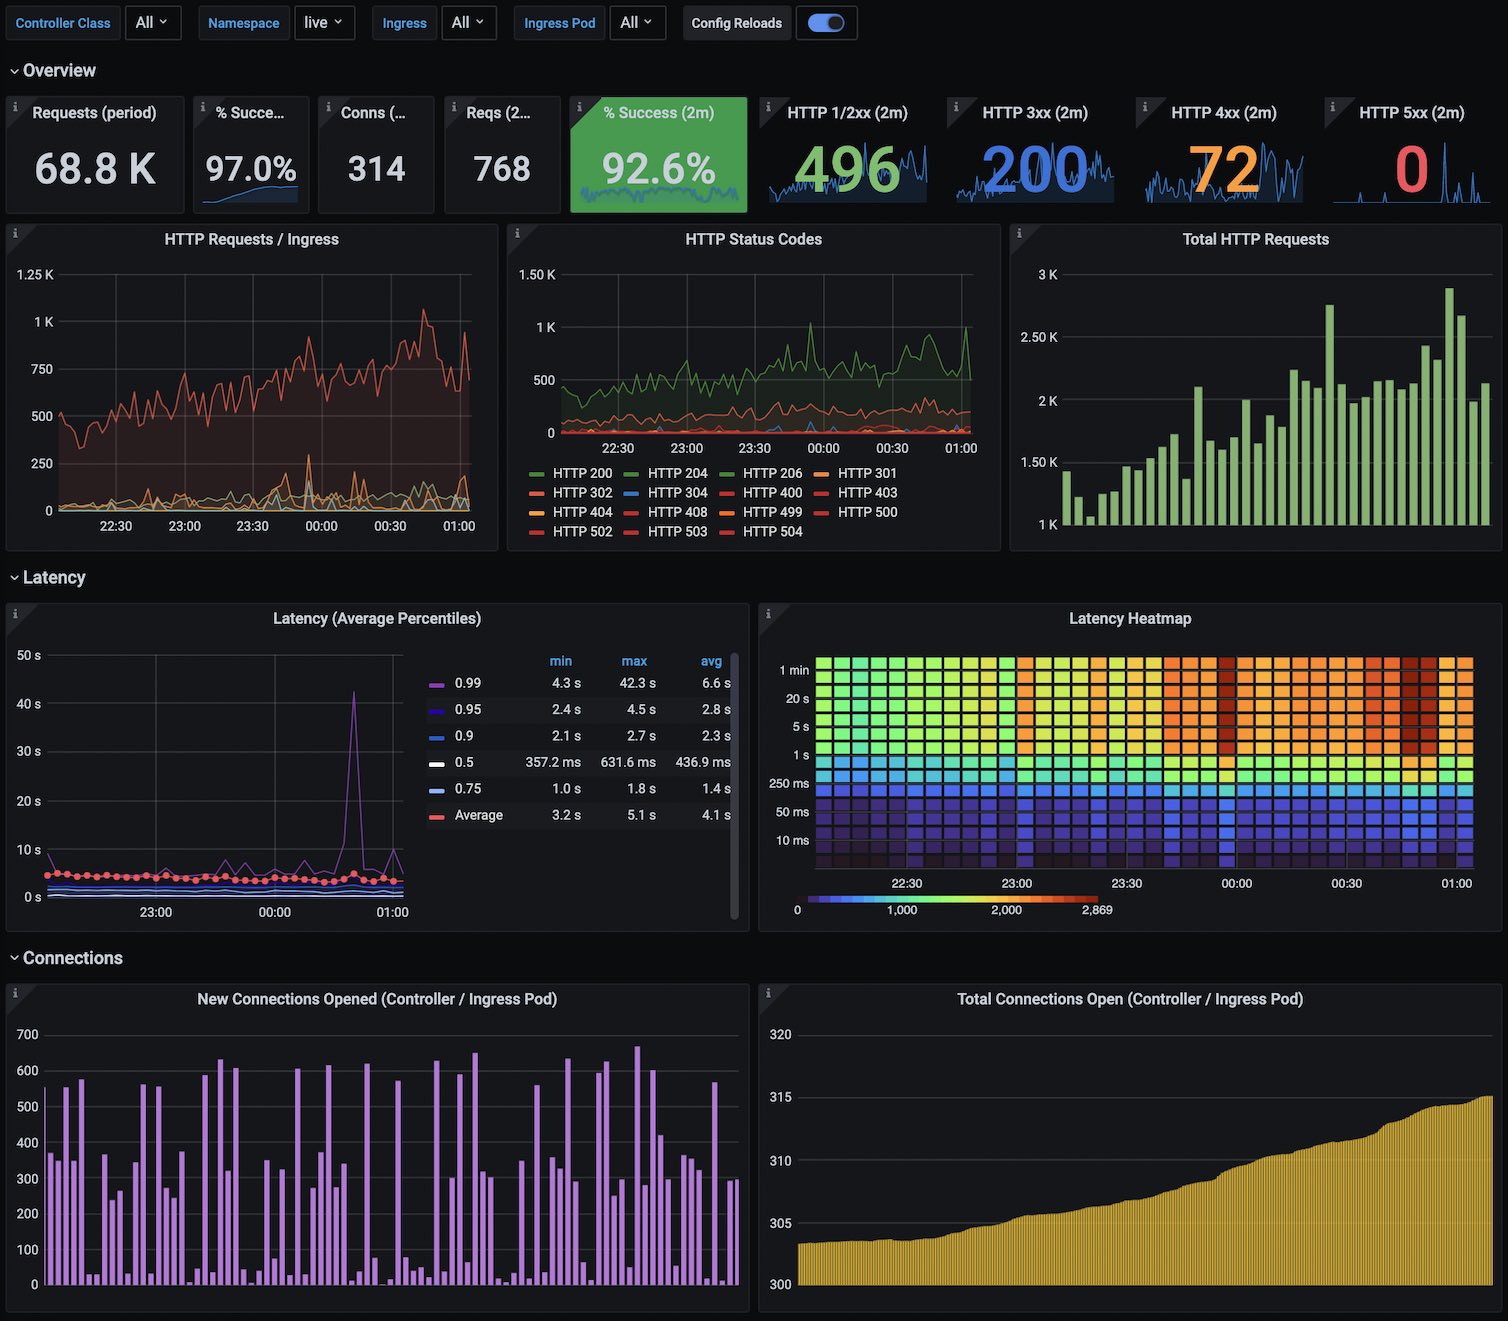
This dashboard monitors the performance and health of a Kubernetes Nginx Ingress setup using Prometheus metrics. It provides per-period and 2-minute window views of request volume, success rate, and HTTP status distribution, alongside latency insight via %-based latency percentiles (via latency metrics) and a heatmap of request duration. Key metrics include nginx_ingress_controller_requests for total/per-status request counts, nginx_ingress_controller_request_duration_seconds_bucket for latency distribution, and nginx_ingress_controller_nginx_process_connections to track active connections; dashboards also surface total vs opened connections across the Controller and Ingress Pod, enabling quick assessment of traffic loads and error patterns such as 4xx/5xx responses.
Screenshots
Used Metrics 44
nginx_ingress_controller_nginx_process_connections
nginx_ingress_controller_request_duration_seconds_bucket
nginx_ingress_controller_requests
s