Kubernetes Monitoring Dashboard 138,920138,920 4.6 (5 reviews)
8/2/2020
8/2/2020
1
>=6.7.2
Prometheus
Description
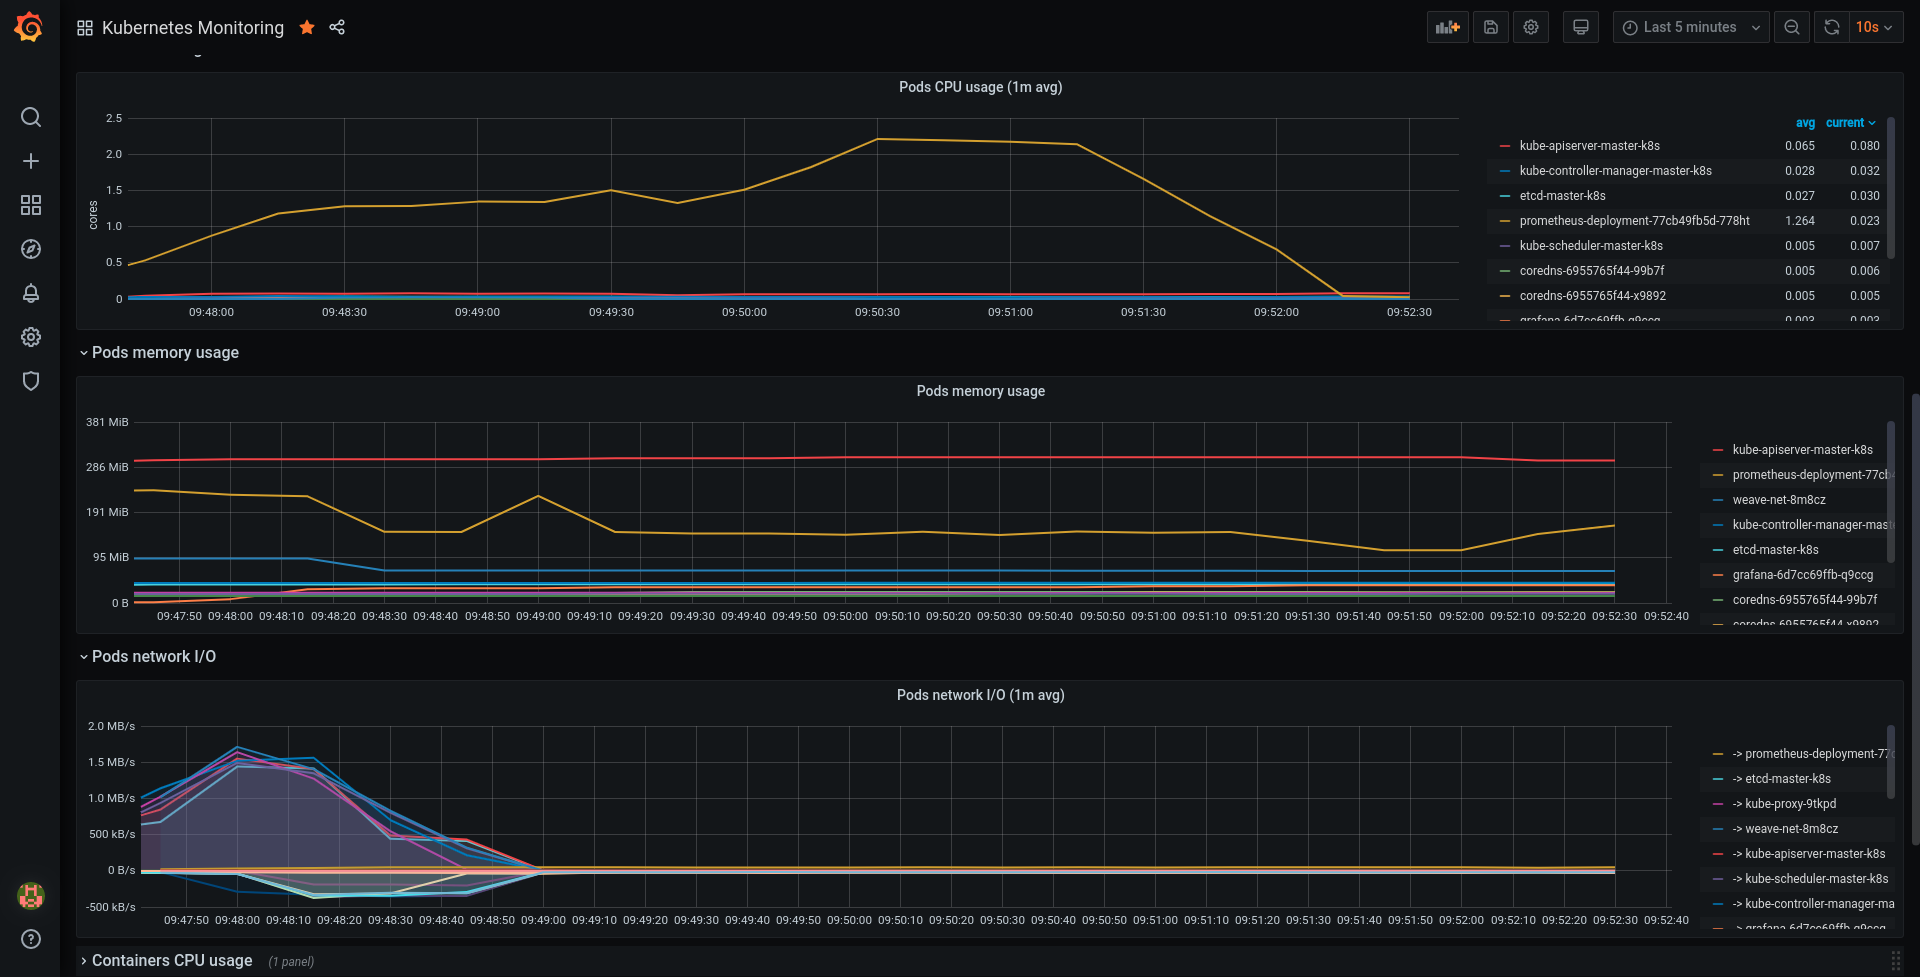
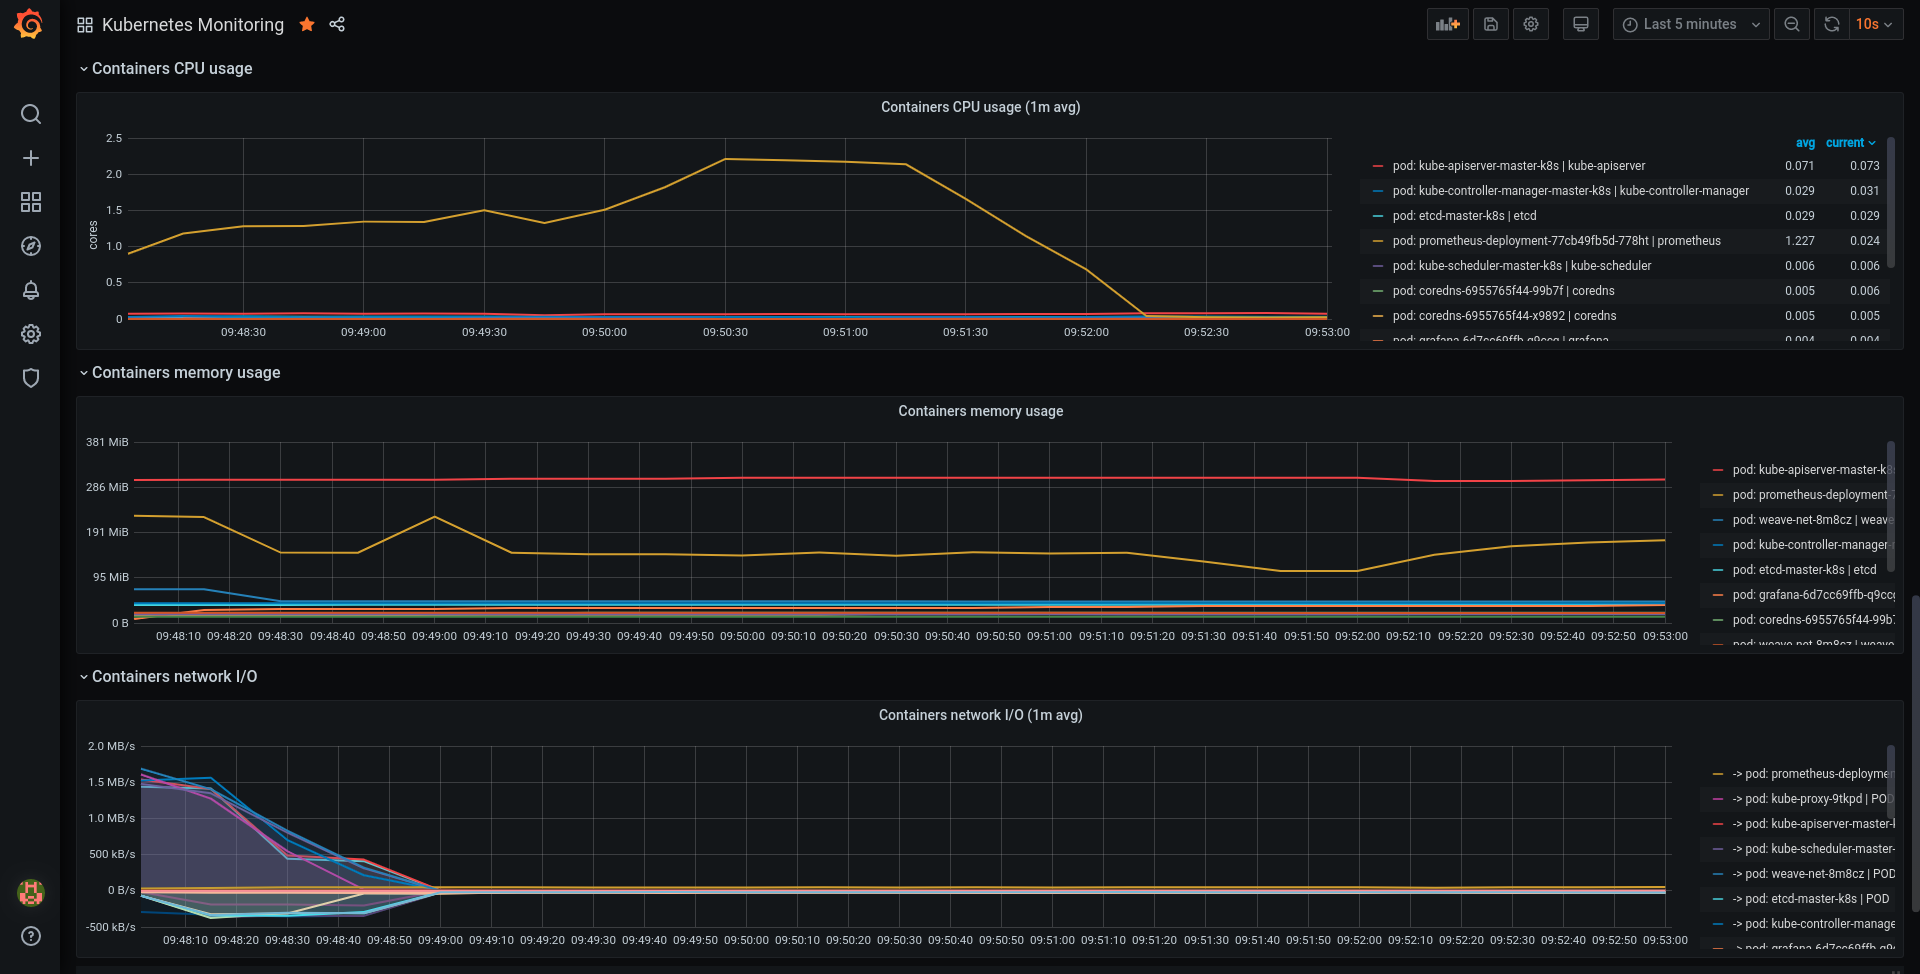
This dashboard provides an at-a-glance view of core Kubernetes resource utilization across the cluster, including CPU, memory, filesystem, and network I/O. It highlights 1-minute averages for CPU and network activity, while also showing used vs. total capacity for memory and filesystem, enabling quick identification of bottlenecks; key metrics include container_cpu_usage_seconds_total, machine_memory_bytes, and container_network_receive_bytes_total (and transmit).
Screenshots

Get Dashboard✕
Download
Copy to Clipboard