Kubernetes monitoring by namespace and instance 8,7618,761
2/28/2022
3/10/2022
7
>=8.3.4
Prometheus
Description
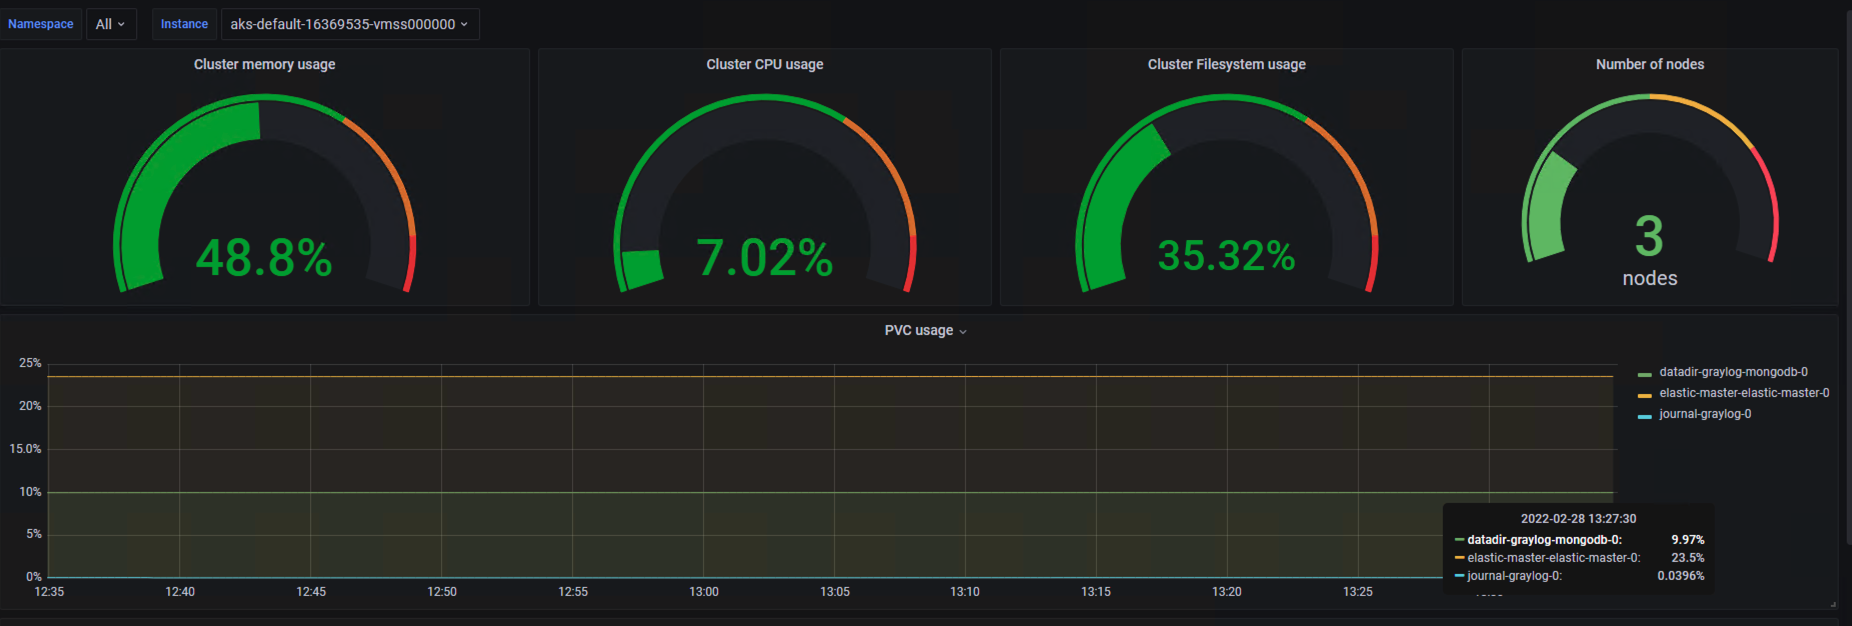
Monitor a Kubernetes cluster using Prometheus. Shows overall cluster CPU / Memory / Disk usage and number of nodes. As a individual and with the posibility of filter by namespace: POD CPU / Memory / Network usage and PVC usage.
Screenshots
Used Metrics 1414
-
container_cpu_usage_seconds_total
-
container_memory_usage_bytes
-
container_network_receive_bytes_total
-
container_network_transmit_bytes_total
kube_node_info
kubelet_volume_stats_capacity_bytes
kubelet_volume_stats_used_bytes
-
node_cpu_seconds_total
-
node_filesystem_free_bytes
-
node_filesystem_size_bytes
-
node_memory_Buffers_bytes
-
node_memory_Cached_bytes
-
node_memory_MemFree_bytes
-
node_memory_MemTotal_bytes
Get Dashboard✕
Download
Copy to Clipboard