Kubernetes Monitor 9,5519,551 4.0 (5 reviews)
12/14/2021
5/18/2022
6
>=8.3.3
Prometheus
Description
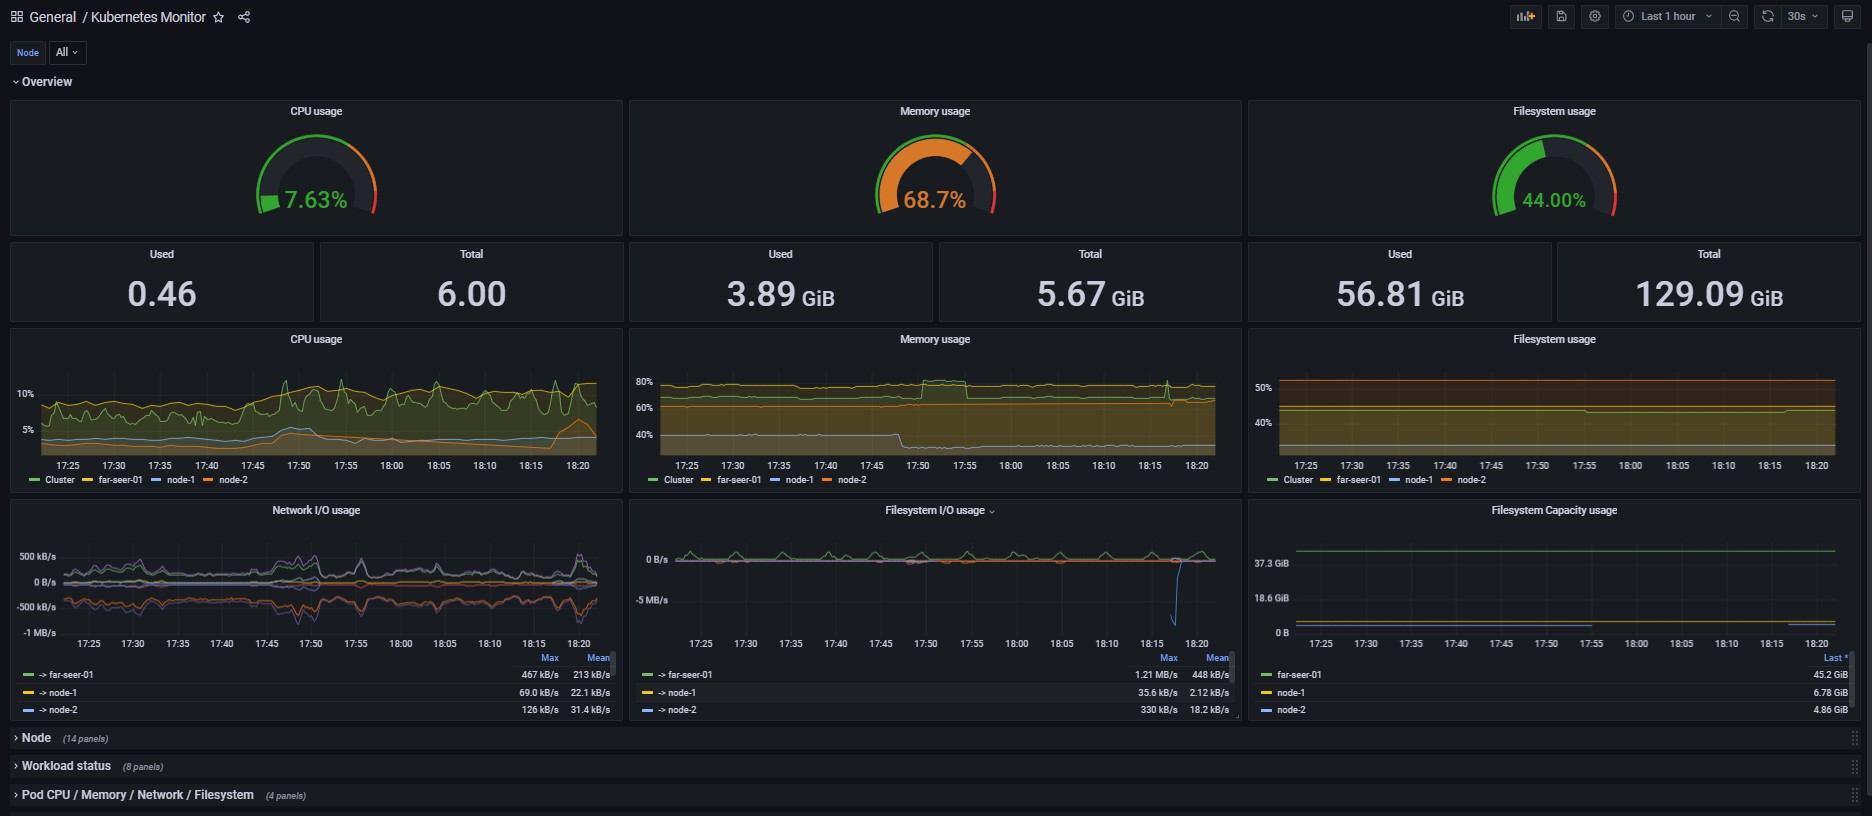
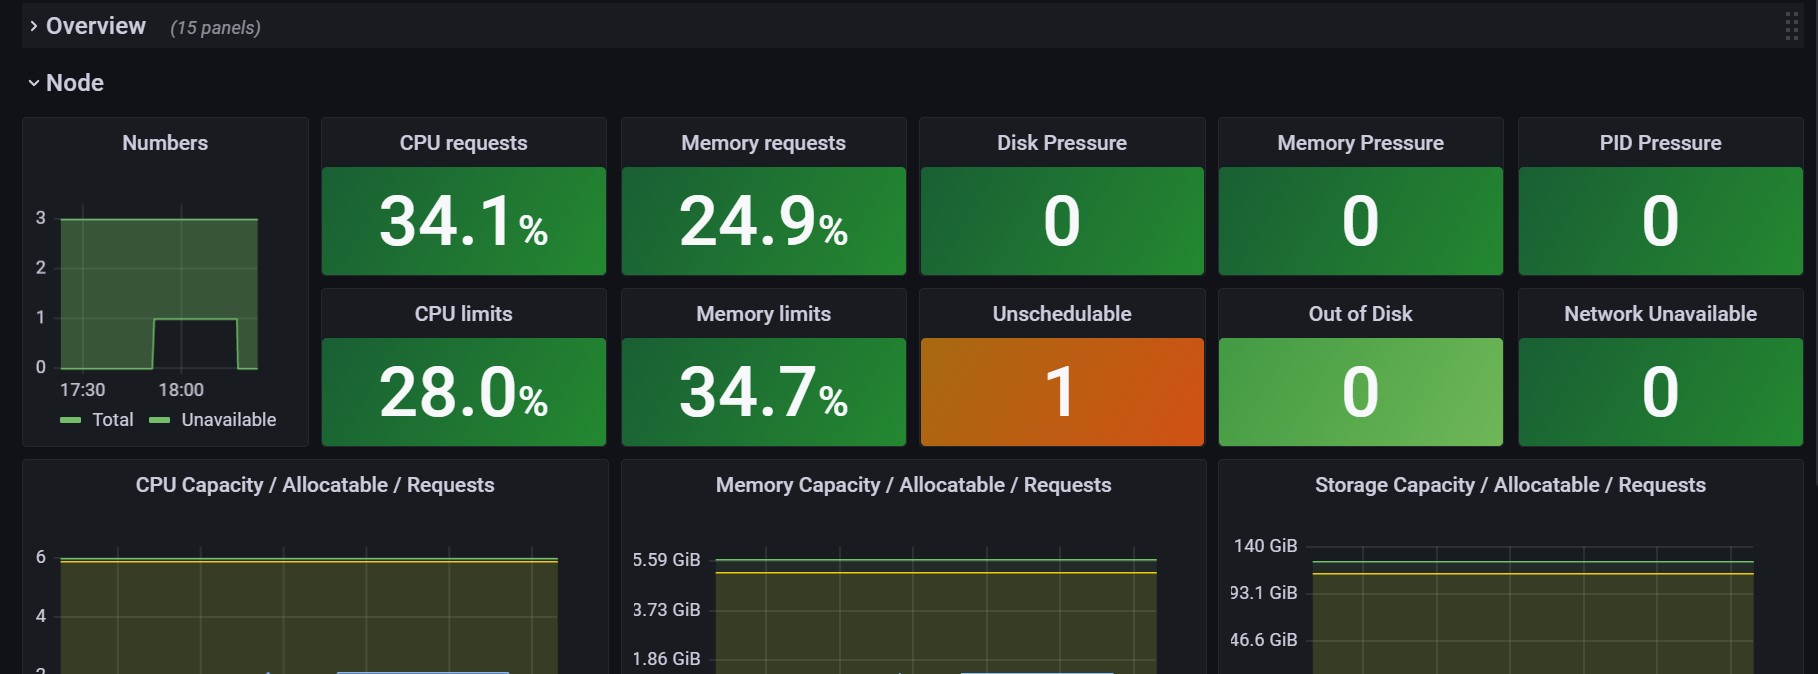
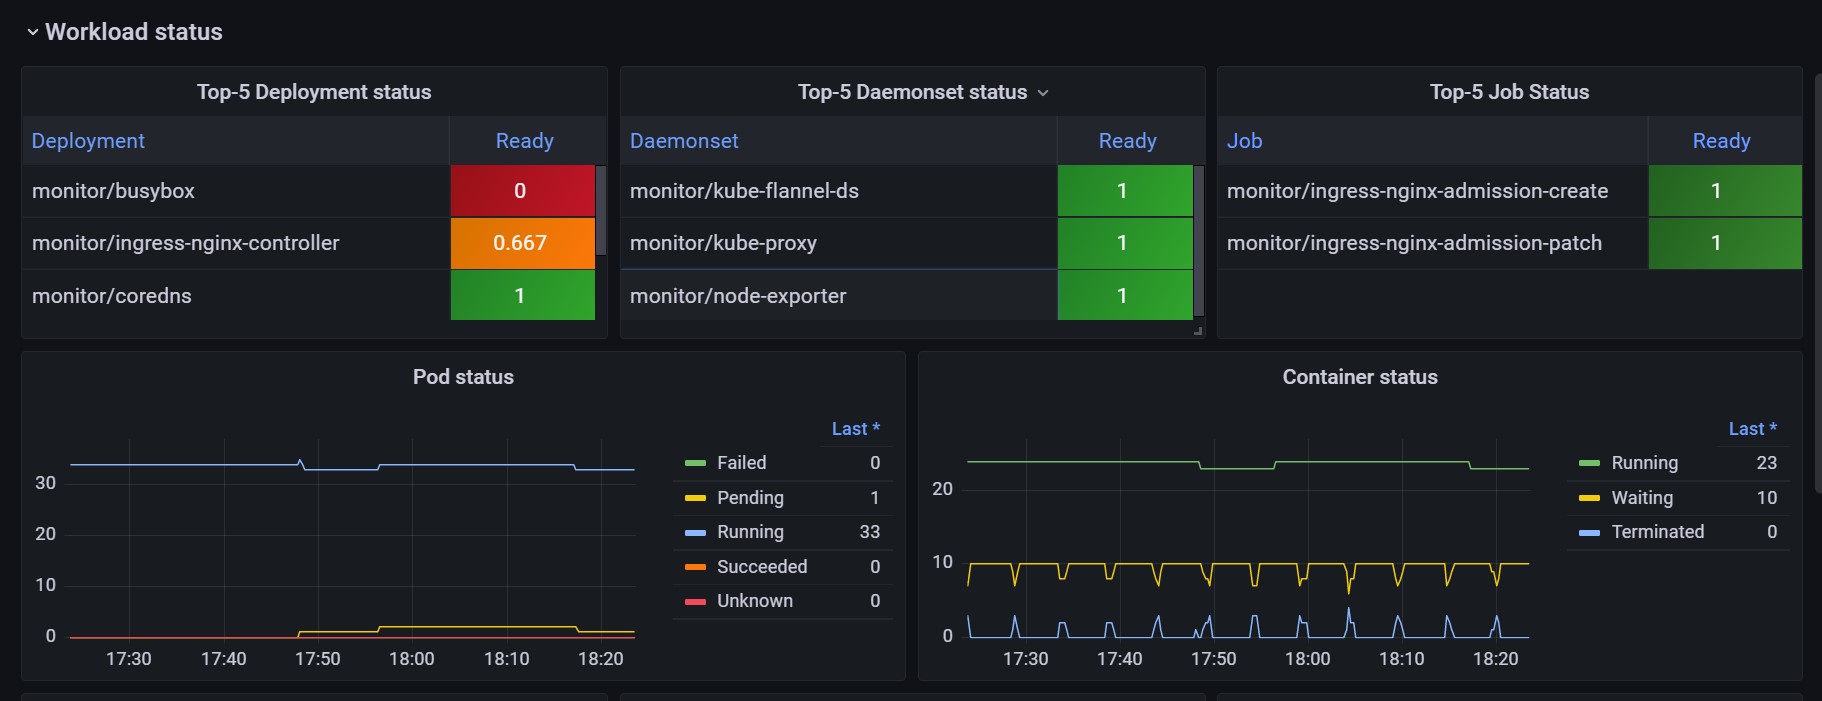
Monitors Kubernetes cluster using Prometheus. Shows overall cluster or Node CPU / Memory / Network/ Filesystem usage as well as individual pod, containers statistics. Uses cAdvisor and kube-state metrics only.
Screenshots
Used Metrics 1010
Get Dashboard✕
Download
Copy to Clipboard