Kubernetes Kafka Overview 45,12245,122
Description
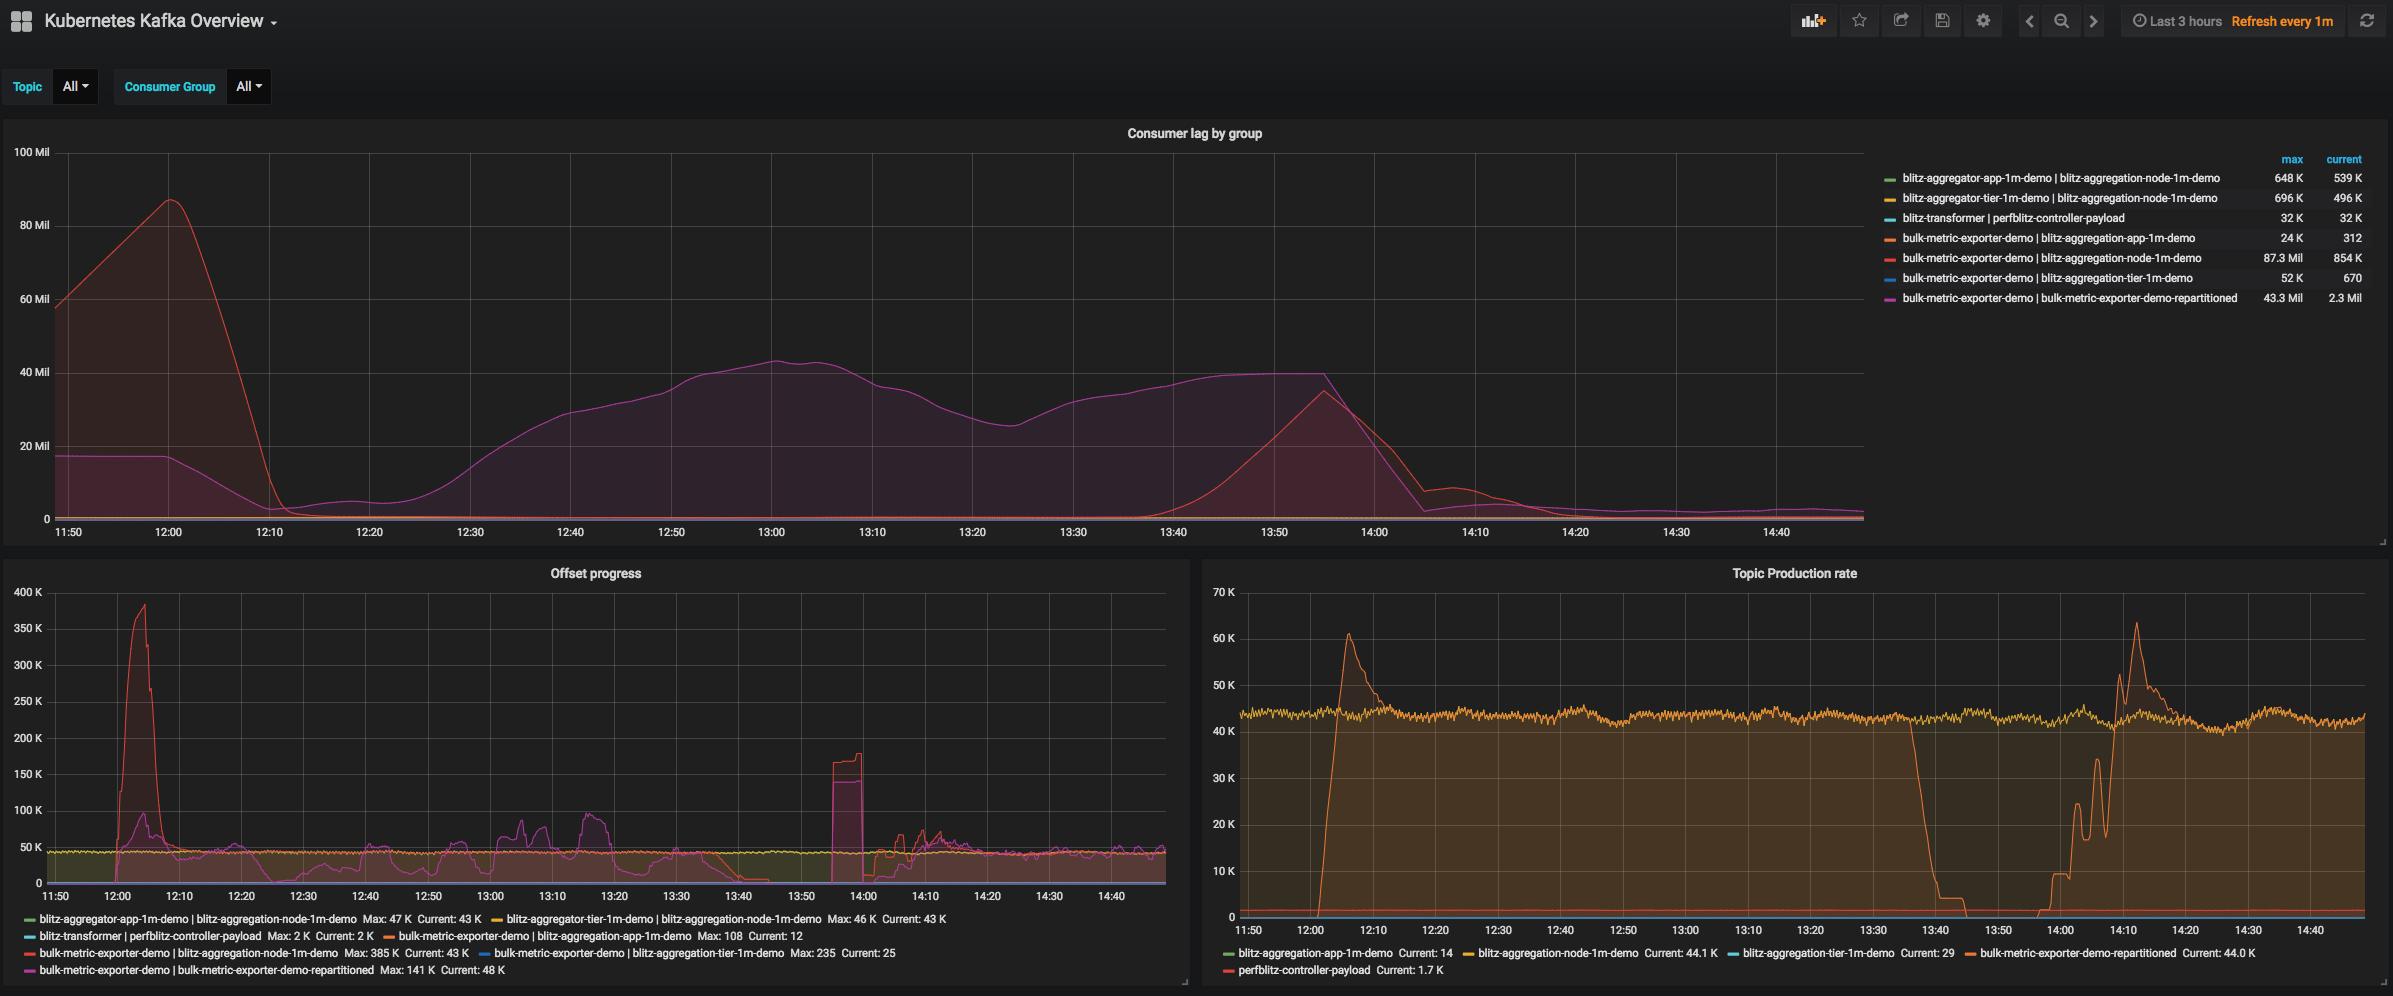
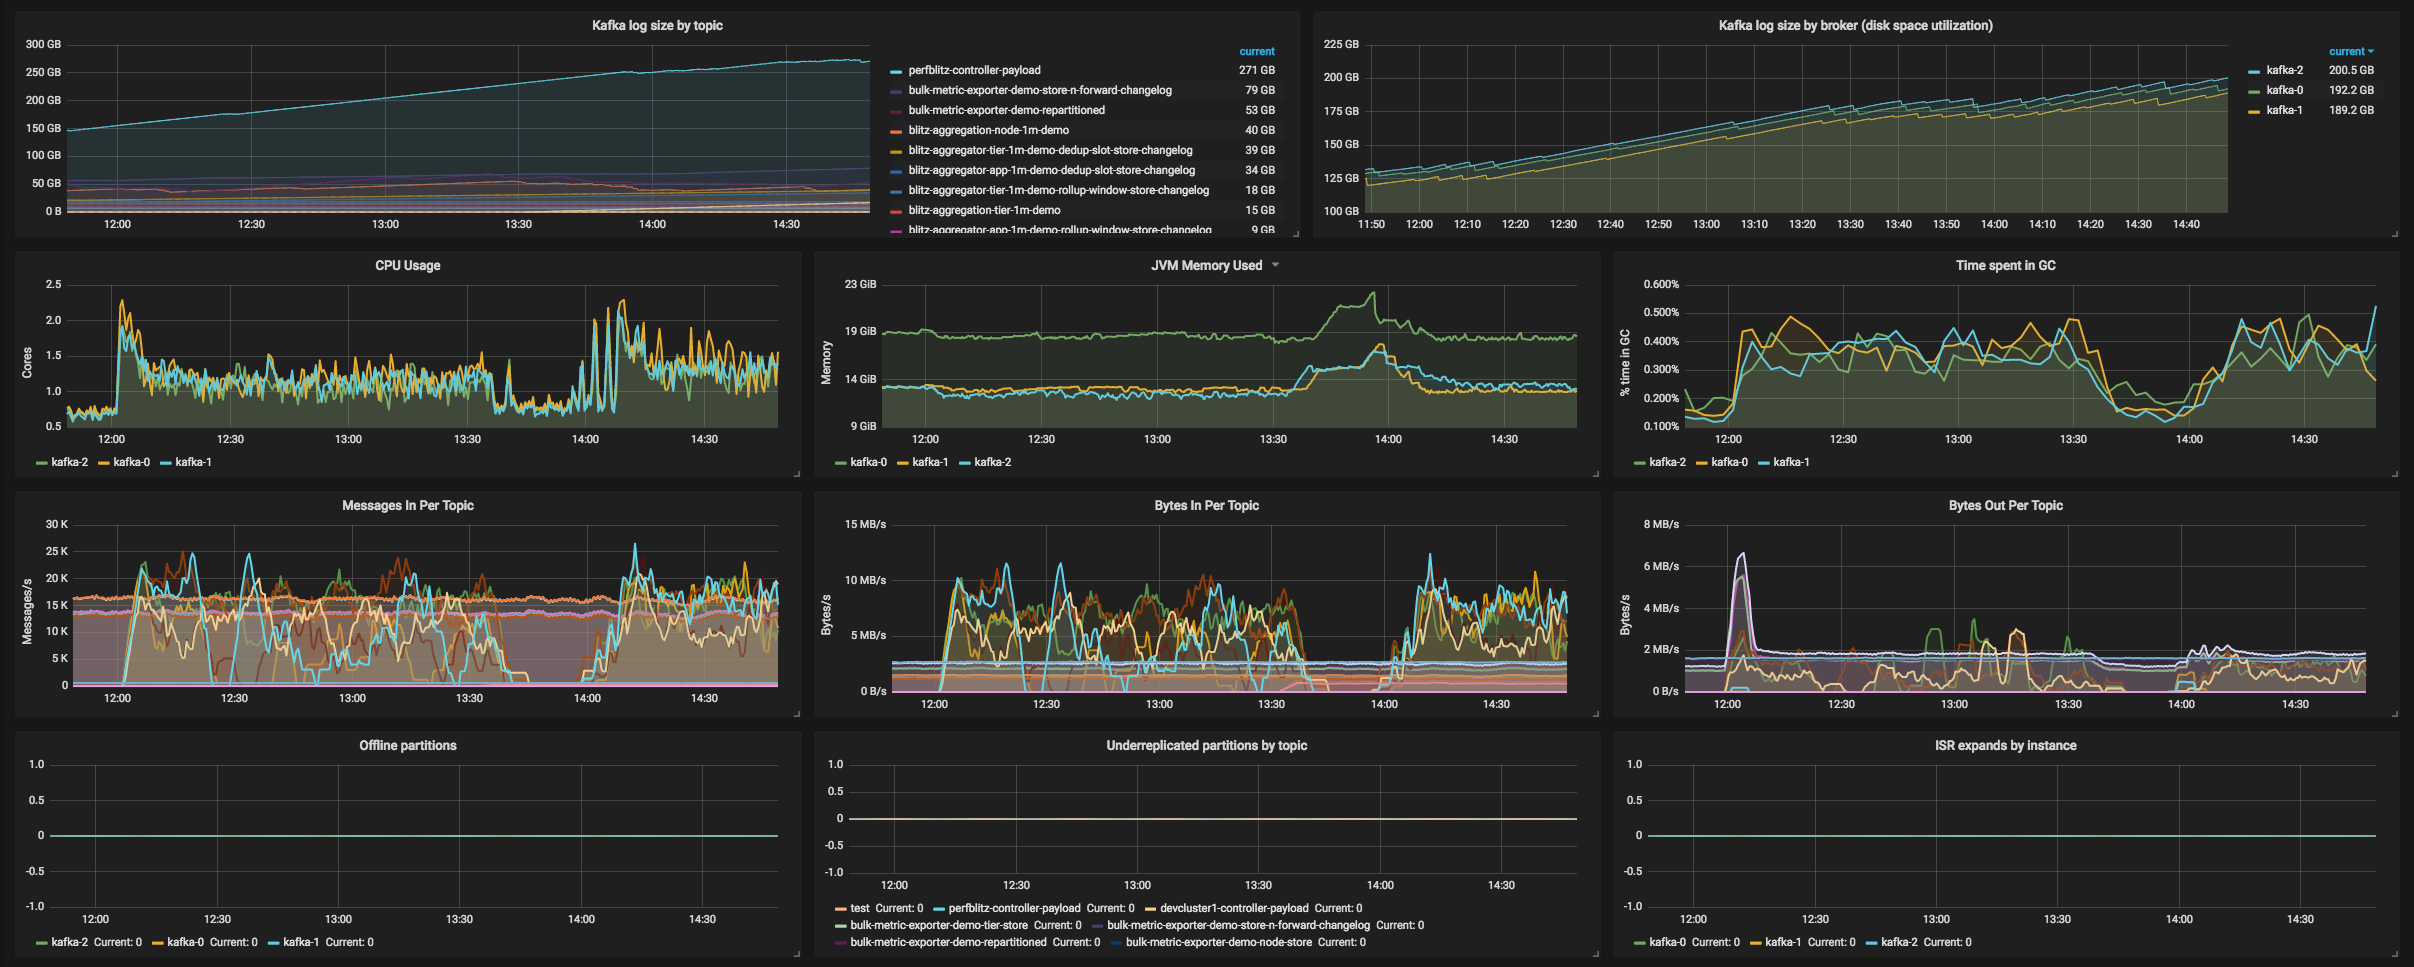
This dashboard provides a comprehensive real-time view into a Kafka-backed Kubernetes deployment, combining stream processing health with cluster resource and topic-level insights. It highlights consumer lag and offset progress with panels like kafka_consumergroup_lag and kafka_consumergroup_current_offset, topic throughput through kafka_server_brokertopicmetrics_messagesin_total and kafka_server_brokertopicmetrics_bytesin_total, and operational metrics such as CPU and memory usage (process_cpu_seconds_total, jvm_memory_bytes_used) and garbage collection (jvm_gc_collection_seconds_sum). Additional coverage includes disk space and topic partition status (e.g., kafka_log_size and kafka_topic_partition_current_offset, as well as partition health indicators like Offline partitions and Underreplicated partitions by topic).
Screenshots
Used Metrics 1414
-
container_memory_usage_bytes
jvm_gc_collection_seconds_sum
jvm_memory_bytes_used
kafka_cluster_partition_underreplicated
-
kafka_consumergroup_current_offset
-
kafka_consumergroup_lag
kafka_controller_kafkacontroller_offlinepartitionscount
kafka_log_size
kafka_server_brokertopicmetrics_bytesin_total
kafka_server_brokertopicmetrics_bytesout_total
kafka_server_brokertopicmetrics_messagesin_total
kafka_server_replicamanager_isrexpands_total
-
kafka_topic_partition_current_offset
-
process_cpu_seconds_total