Kubernetes JMX Dashboard 65,13465,134 5.0 (2 reviews)
11/8/2019
11/10/2019
2
>=6.4.3
Prometheus
Description
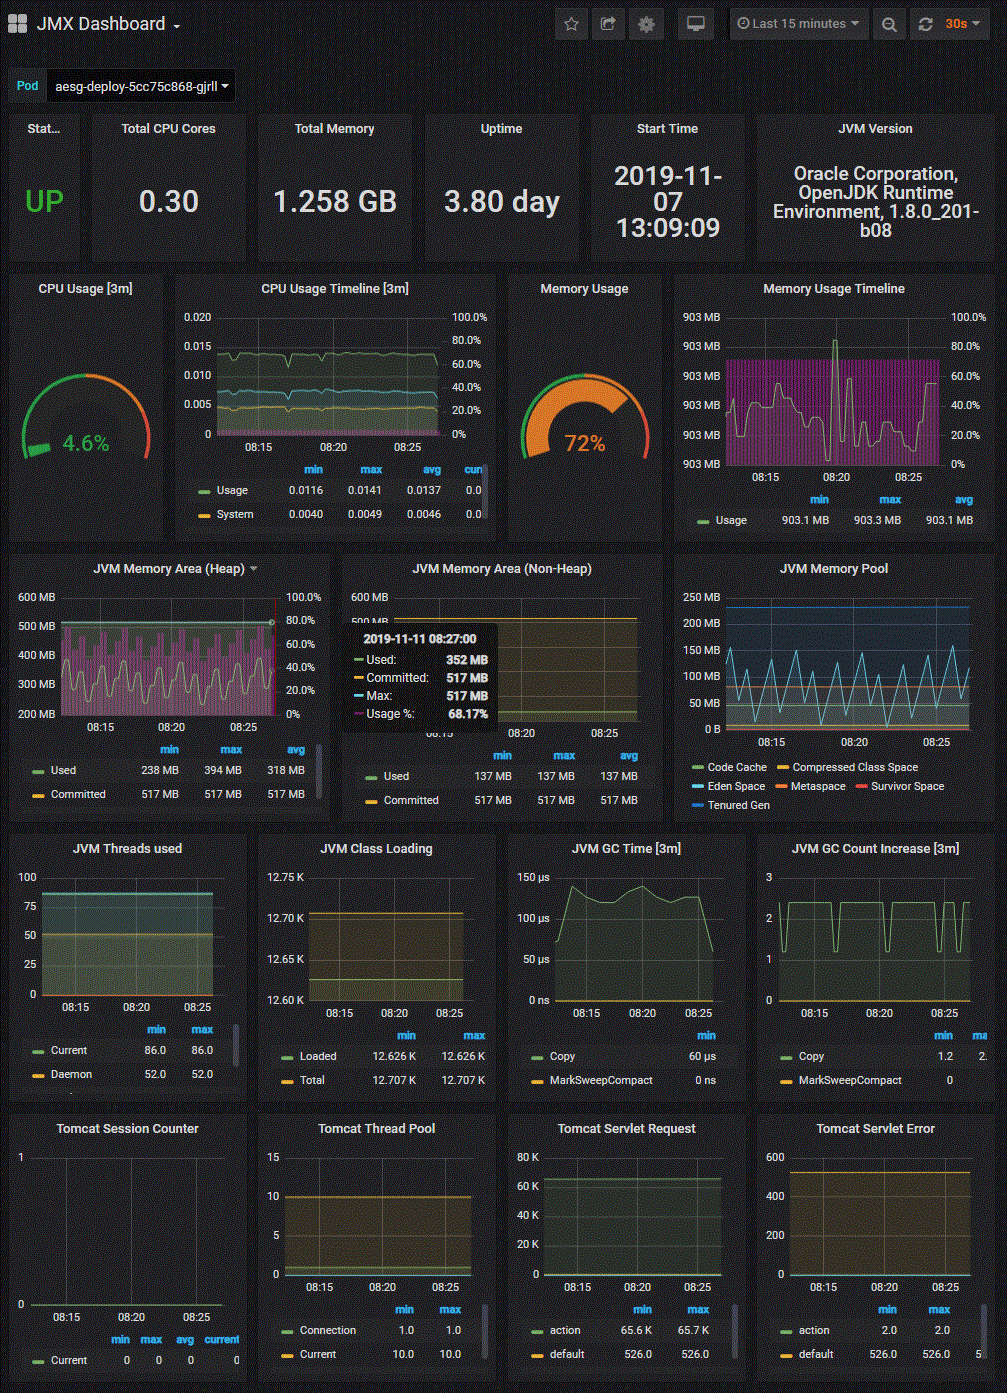
This dashboard monitors Java Virtual Machine metrics exposed via JMX for Kubernetes workloads, focusing on JVM health and performance. It emphasizes latency and throughput aspects through panels tracking metrics like java.lang:type=Memory HeapMemoryUsage used, java.lang:type=Memory HeapMemoryUsage max, and java.lang:type=GarbageCollectorGC count to surface garbage collection impact and memory pressure. Key features include real-time assertions on heap usage, GC activity trends, and resource allocation vs. capacity, enabling quick diagnosis of JVM stability within Kubernetes pods.
Screenshots

Get Dashboard✕
Download
Copy to Clipboard