Kubernetes Ingress Controller Dashboard 152,271152,271
Description
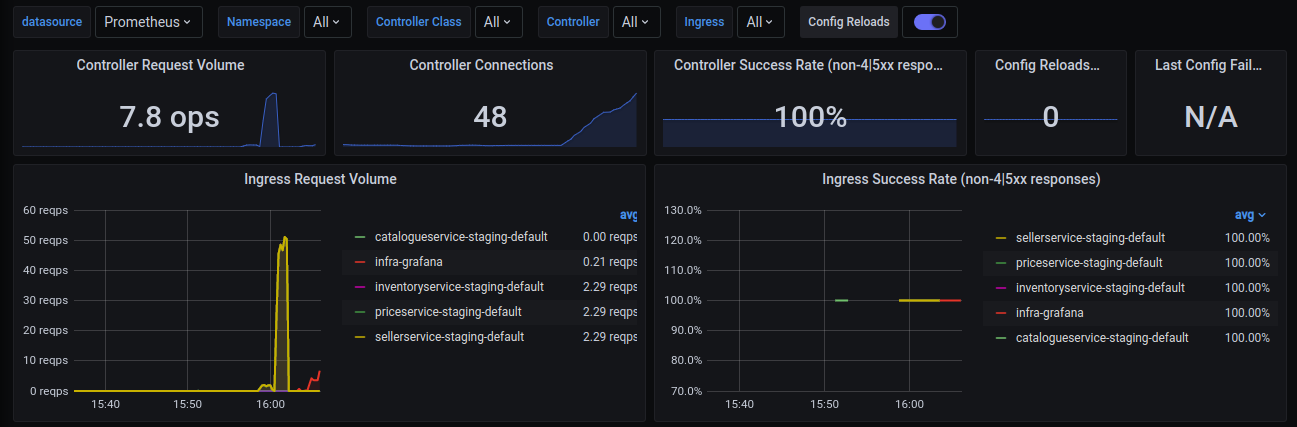
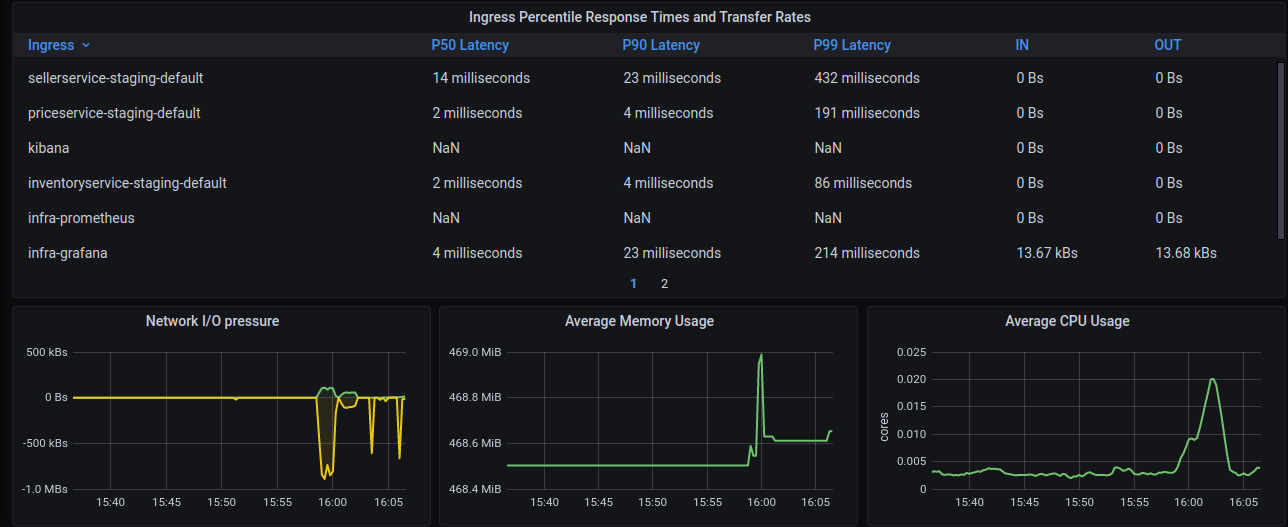
This dashboard monitors the health and performance of an NGINX Ingress Controller, focusing on request handling, success rates, and resource usage. It highlights latency and throughput with nginx_ingress_controller_request_duration_seconds_bucket and nginx_ingress_controller_requests, tracks reliability via nginx_ingress_controller_success and the latest config status with nginx_ingress_controller_config_last_reload_successful, and surfaces resource pressure through nginx_ingress_controller_nginx_process_resident_memory_bytes and nginx_ingress_controller_nginx_process_cpu_seconds_total. Overall, it provides visibility into request volumes, error-free responses, config reload stability, and per-process resource consumption.
Screenshots
Used Metrics 99
nginx_ingress_controller_config_last_reload_successful
nginx_ingress_controller_nginx_process_connections
nginx_ingress_controller_nginx_process_cpu_seconds_total
nginx_ingress_controller_nginx_process_resident_memory_bytes
nginx_ingress_controller_request_duration_seconds_bucket
nginx_ingress_controller_request_size_sum
nginx_ingress_controller_requests
nginx_ingress_controller_response_size_sum
nginx_ingress_controller_success