Kubernetes Cluster Overall Dashboard 3,0743,074 5.0 (4 reviews)
Description
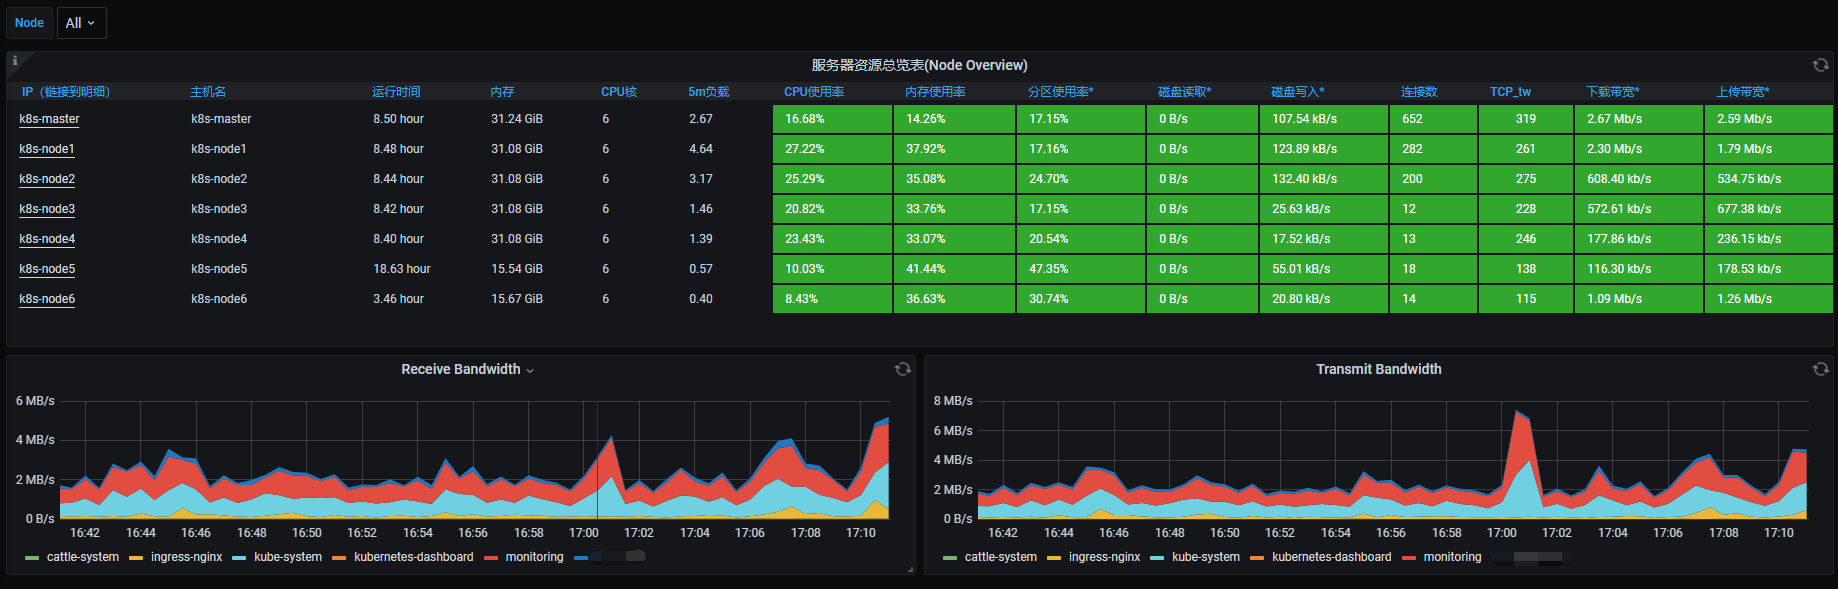
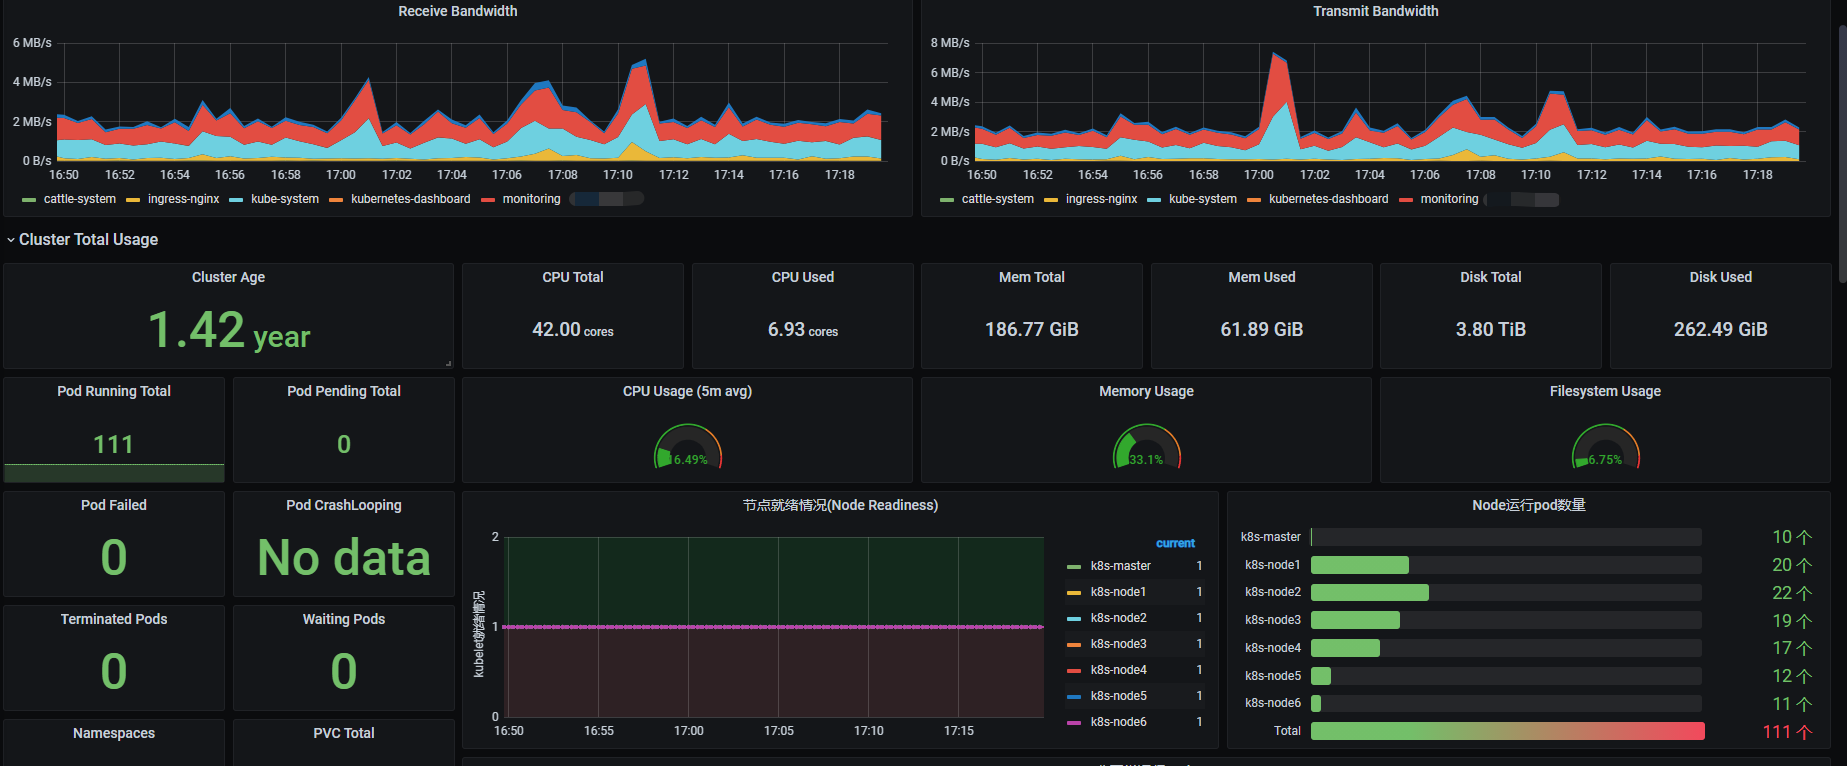
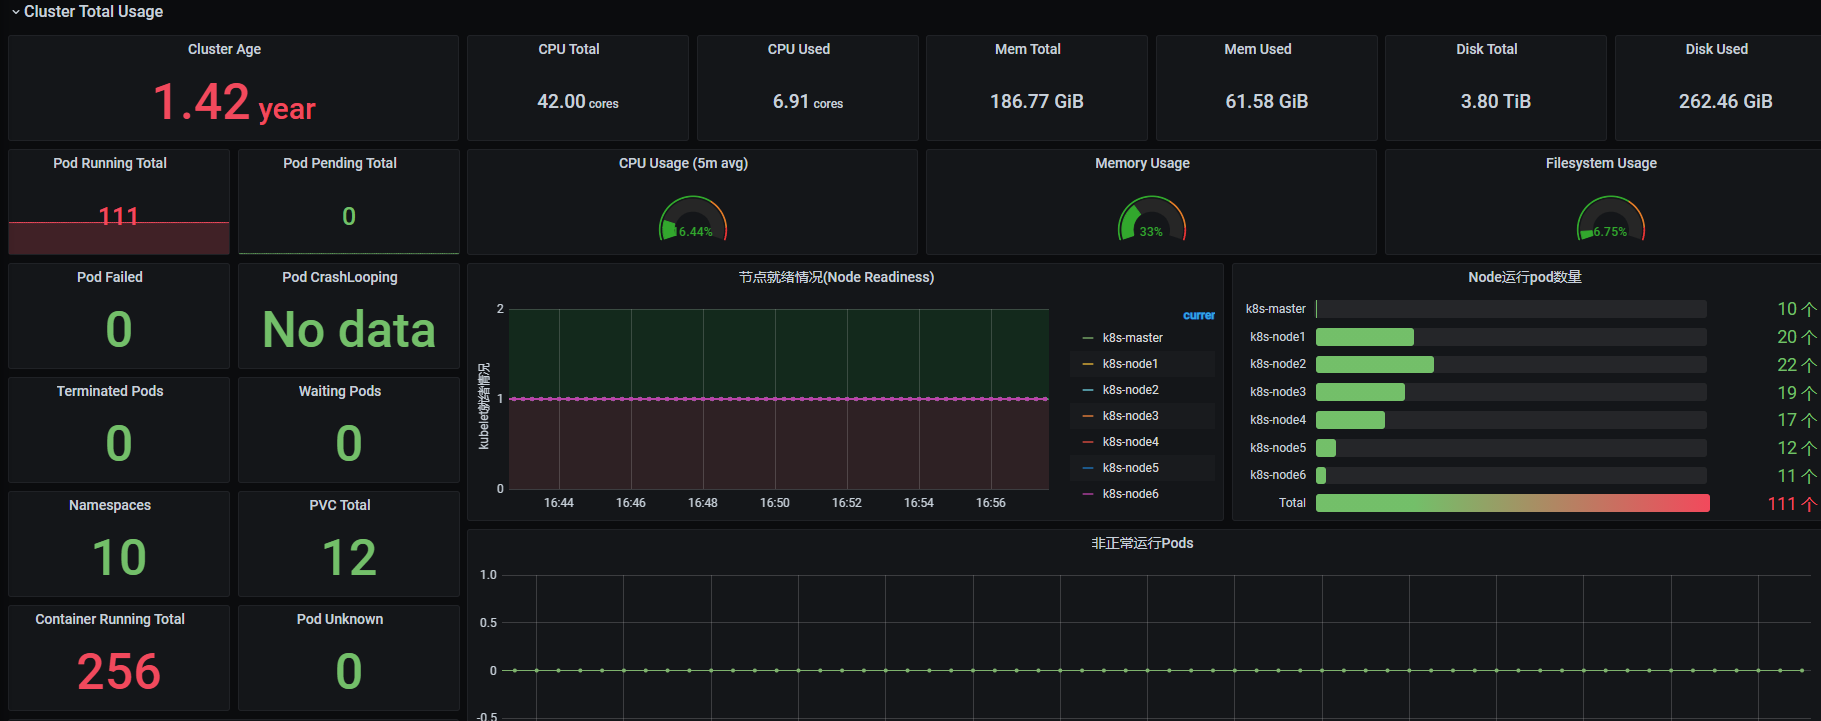
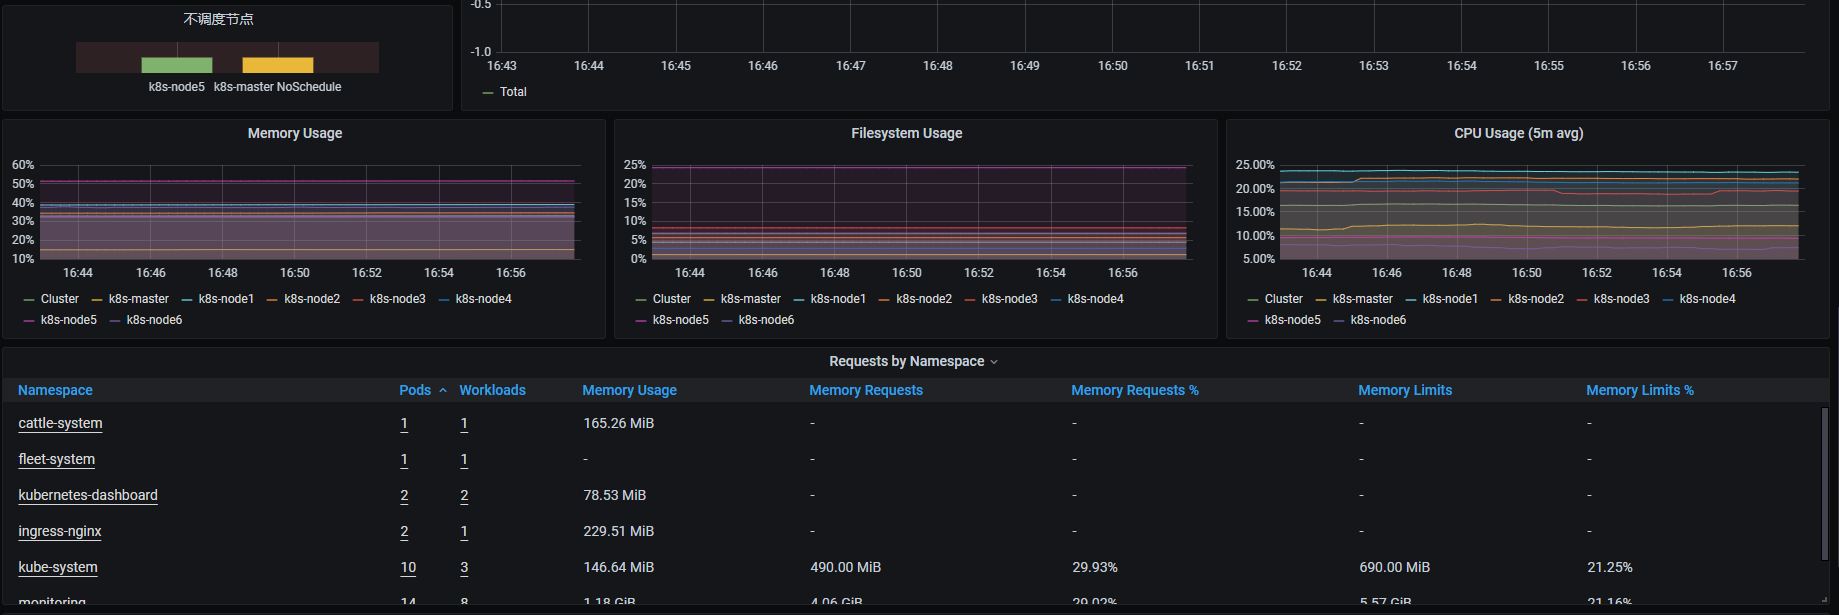
Monitors Kubernetes cluster using Prometheus. Shows overall cluster or Node CPU / Memory / Filesystem 基于K8 Cluster Detail Dashboard 和 Kubernetes for Prometheus Dashboard CN 20201209 修改,调整了布局
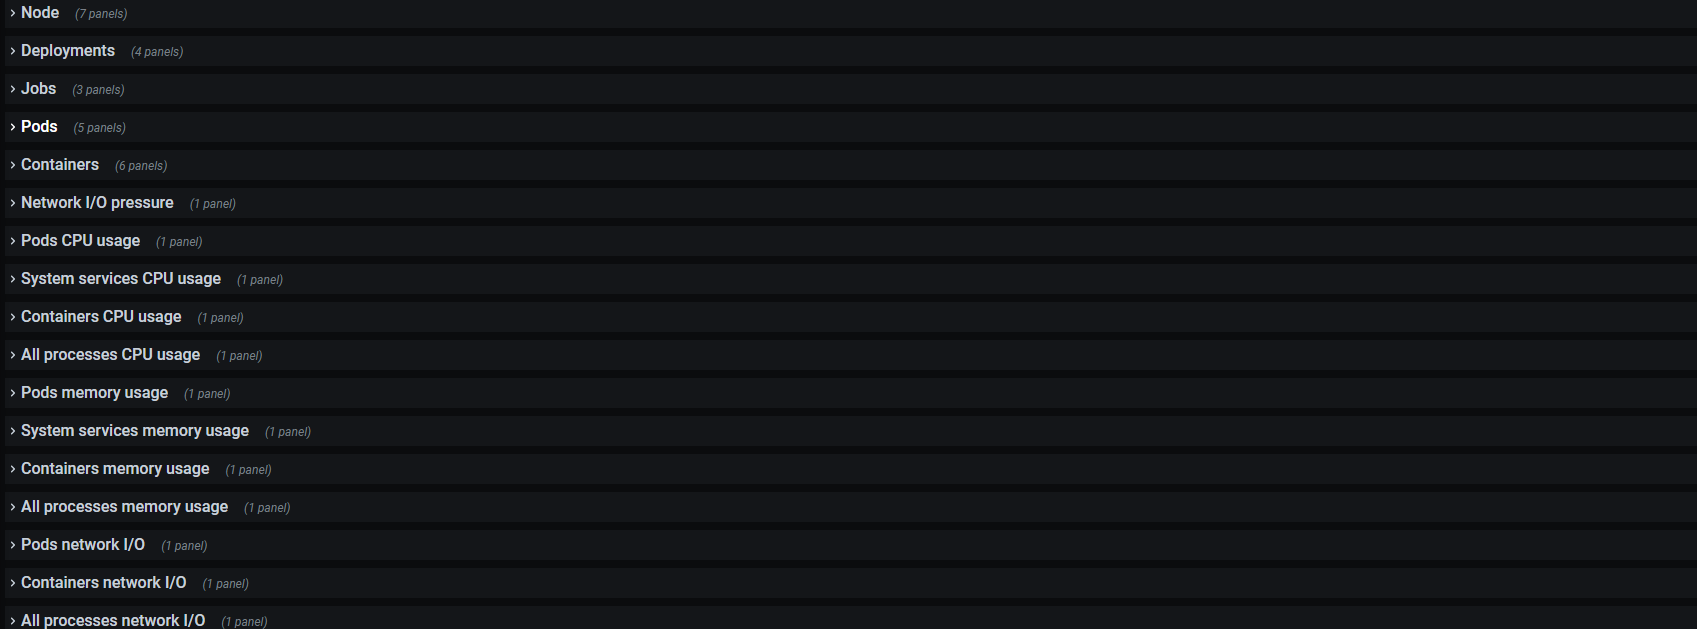
Screenshots
Used Metrics 4545
-
container_cpu_usage_seconds_total
-
container_fs_limit_bytes
-
container_fs_usage_bytes
-
container_memory_rss
-
container_memory_working_set_bytes
-
container_network_receive_bytes_total
-
container_network_receive_packets_dropped_total
-
container_network_receive_packets_total
-
container_network_transmit_bytes_total
-
container_network_transmit_packets_dropped_total
-
container_network_transmit_packets_total
kube_namespace_created
kube_node_spec_taint
kube_node_spec_unschedulable
kube_node_status_condition
kube_persistentvolumeclaim_info
kube_pod_container_resource_limits
kube_pod_container_resource_requests
kube_pod_container_status_restarts_total
kube_pod_container_status_terminated_reason
kube_pod_container_status_waiting
kube_pod_container_status_waiting_reason
kube_pod_info
kube_pod_owner
kube_pod_status_phase
kube_service_created
kubelet_running_container_count
-
machine_cpu_cores
-
machine_memory_bytes
namespace_workload_pod:kube_pod_owner:relabel
-
node_boot_time_seconds
-
node_cpu_seconds_total
-
node_disk_read_bytes_total
-
node_disk_written_bytes_total
-
node_filesystem_avail_bytes
-
node_filesystem_free_bytes
-
node_filesystem_size_bytes
-
node_load5
-
node_memory_MemAvailable_bytes
-
node_memory_MemTotal_bytes
-
node_netstat_Tcp_CurrEstab
-
node_network_receive_bytes_total
-
node_network_transmit_bytes_total
-
node_sockstat_TCP_tw
-
node_uname_info