Kubernetes cluster monitoring (via Prometheus) 11,200,49811,200,498
3/3/2017
3/3/2017
1
DockerHost Metrics
>=3.1.1
Prometheus
Description
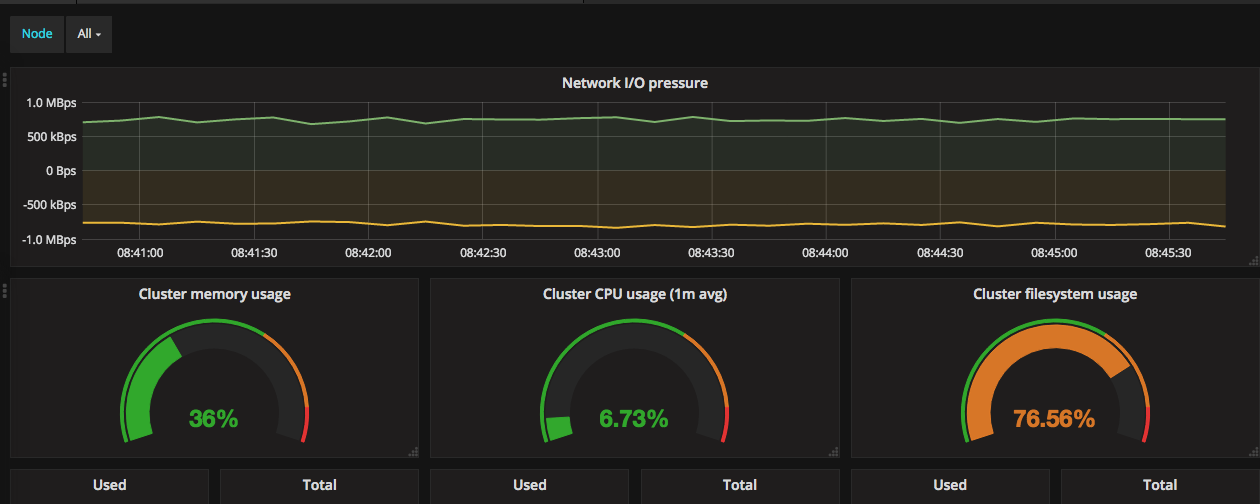
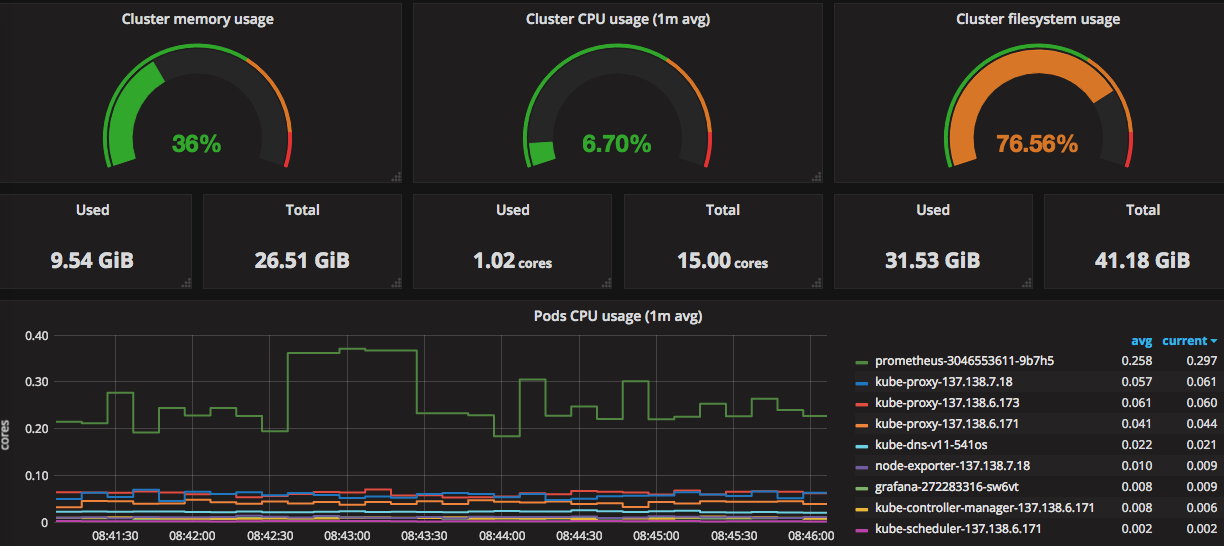
Monitors Kubernetes cluster health and resource utilization by visualizing core Prometheus metrics across nodes, pods, and containers. Key features include node-level capacity and usage trends, pod status and container restarts, and network and disk I/O activity. Focused metrics such as node_memory_utilization, container_restart_count, and container_cpu_usage_seconds_total enable rapid detection of bottlenecks and anomalous behavior.
Screenshots
Get Dashboard✕
Download
Copy to Clipboard