Kubernetes cluster monitoring (via Prometheus) 10,29310,293
7/12/2016
7/20/2016
1
Web Servers
>=3.1.0
Prometheus
Description
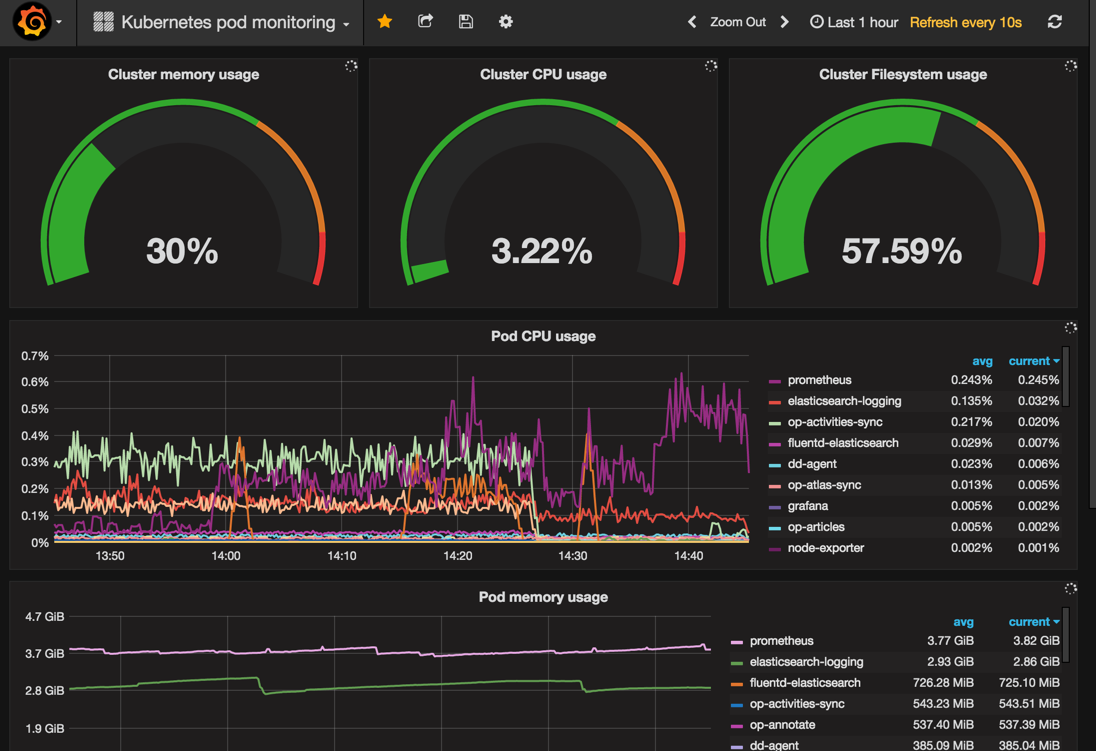
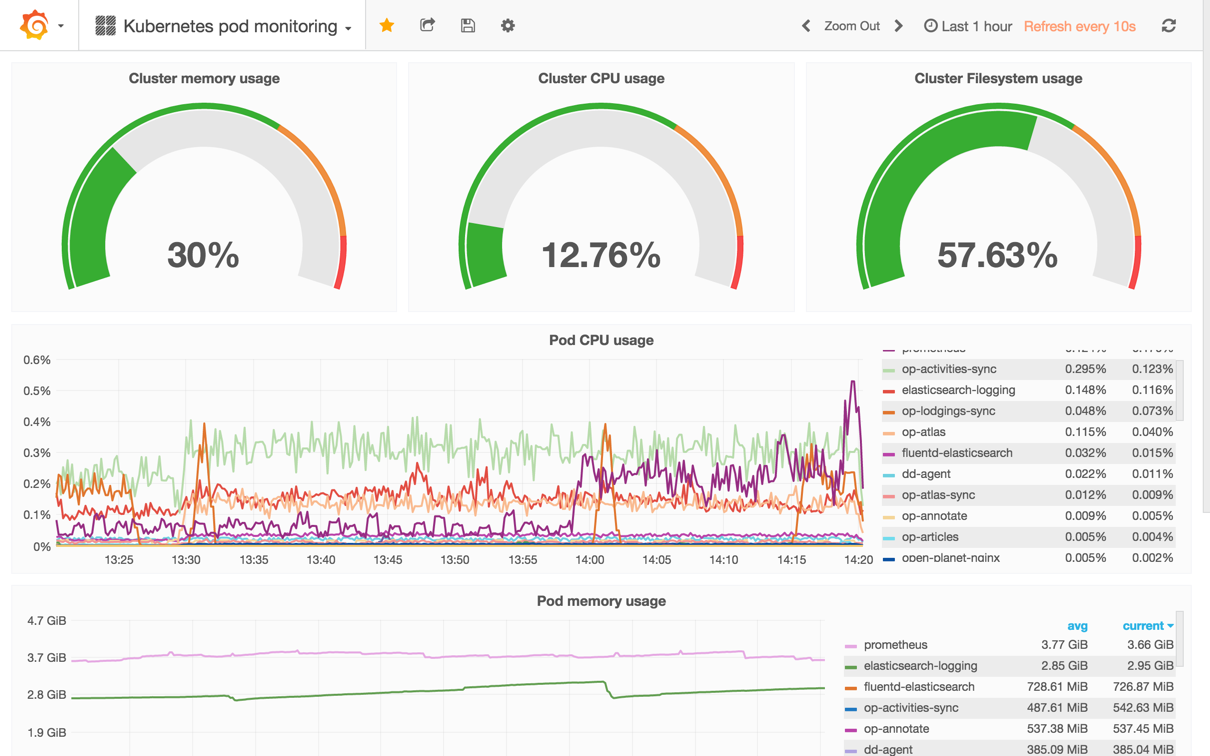
Monitor a Kubernetes cluster using Prometheus TSDB. Shows overall cluster CPU / Memory / Disk usage as well as individual pod statistics.
Screenshots
Get Dashboard✕
Download
Copy to Clipboard