Kubernetes cluster monitoring via Prometheus 1,9921,992
12/2/2020
12/2/2020
1
>=7.3.3
Prometheus
Description
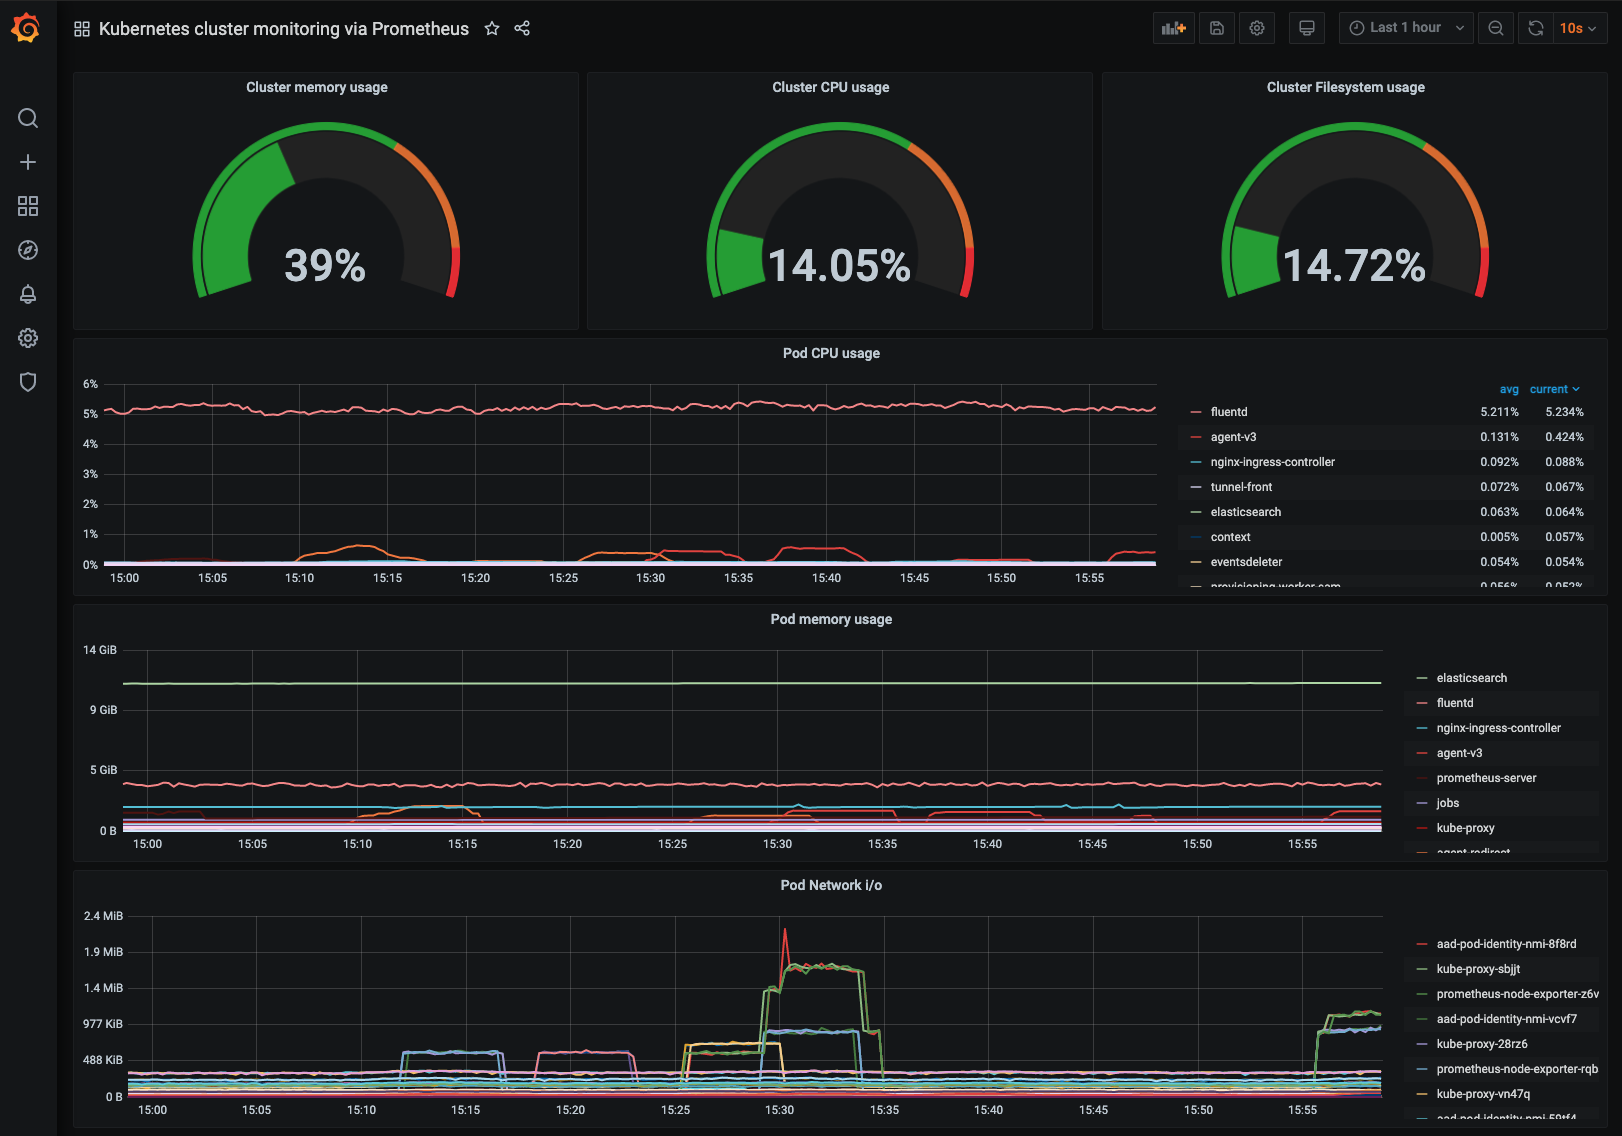
Monitor a Kubernetes cluster using Prometheus 2.22.1. Shows overall cluster CPU / Memory / Disk usage as well as individual pod statistics.
Modified version of dashboard #162
Screenshots
Used Metrics 1111
-
container_cpu_usage_seconds_total
-
container_memory_usage_bytes
-
container_network_receive_bytes_total
-
container_network_transmit_bytes_total
-
node_cpu_seconds_total
-
node_filesystem_free_bytes
-
node_filesystem_size_bytes
-
node_memory_Buffers_bytes
-
node_memory_Cached_bytes
-
node_memory_MemFree_bytes
-
node_memory_MemTotal_bytes
Get Dashboard✕
Download
Copy to Clipboard