Kubernetes Cluster for RAM and CPU Utilization 13,03013,030
8/18/2022
8/18/2022
2
>=9.0.5
Prometheus
Description
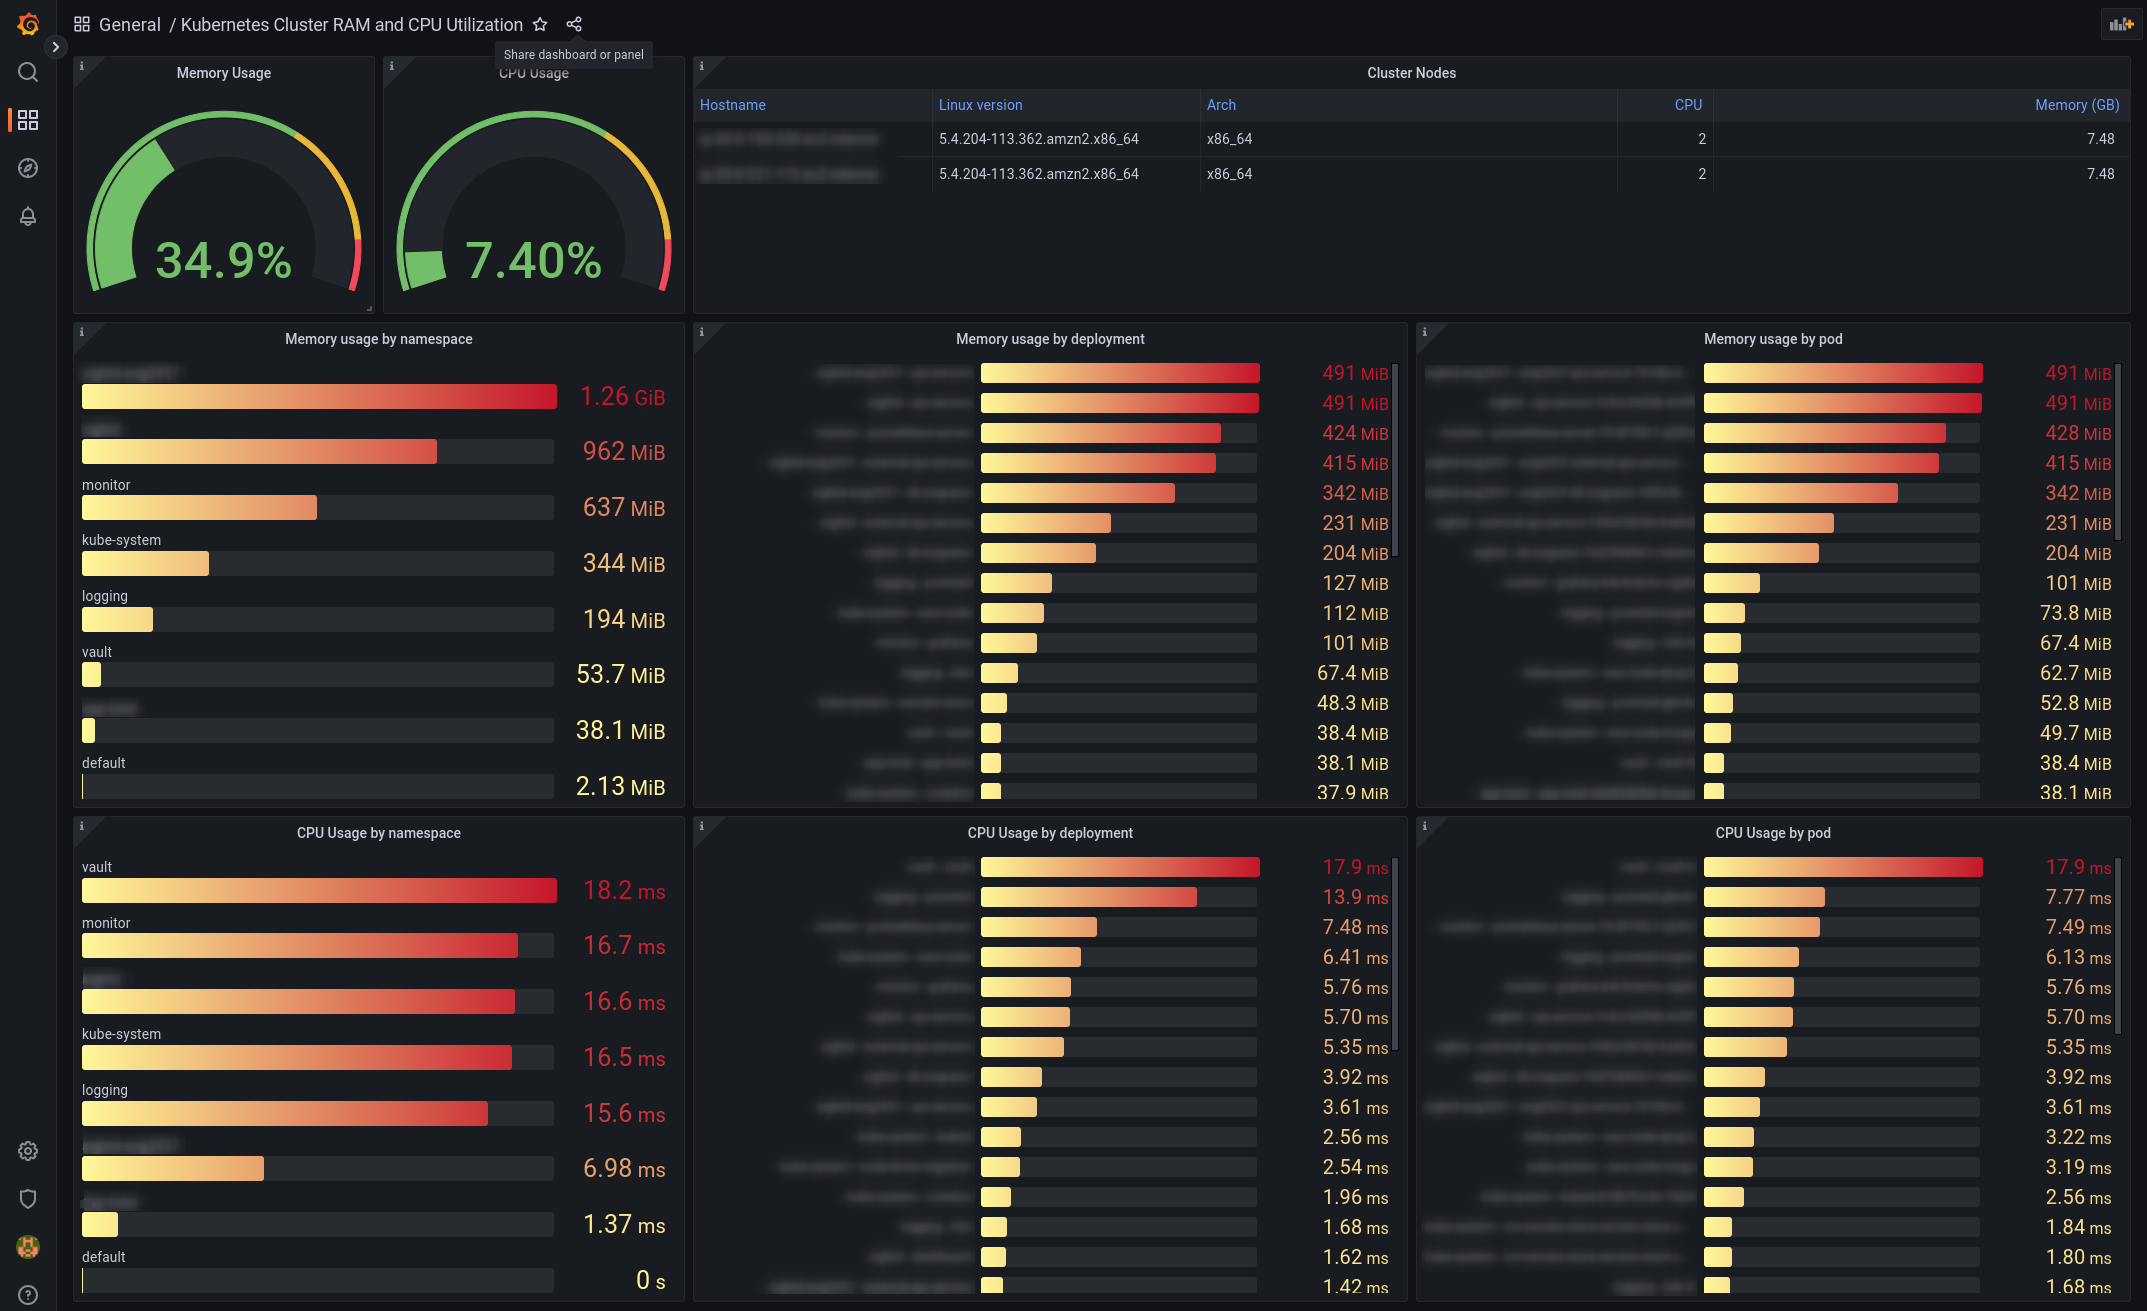
Shows RAM and CPU utilization grouped by namespaces, deployments and specific pods. This dashboard shows the values at specific point in time, its useful for getting an instant feeling about what takes most of the resources in the cluster.
Screenshots
Get Dashboard✕
Download
Copy to Clipboard