Kubernetes Calico 76,95376,953
9/18/2017
10/30/2017
1
>=4.4.3
Prometheus
Description
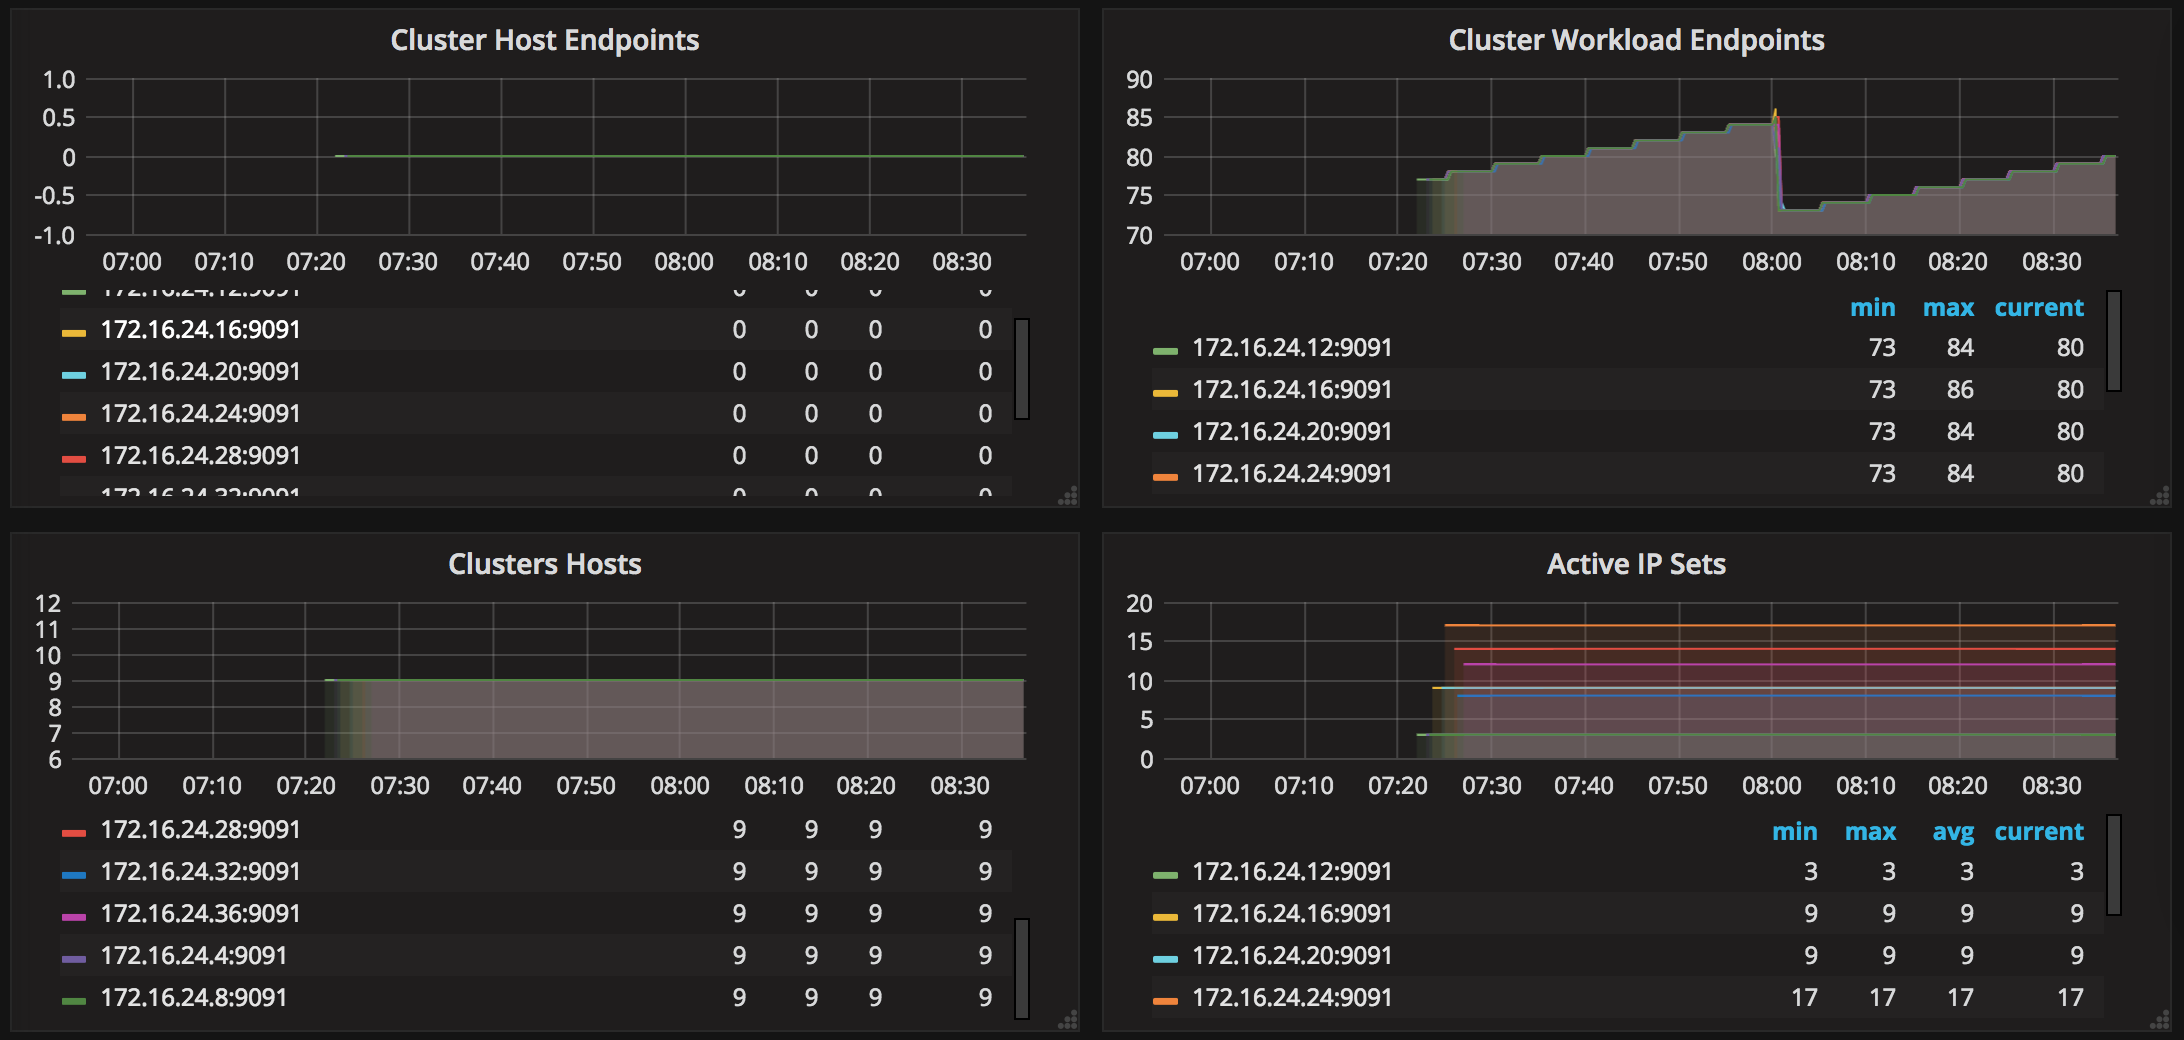
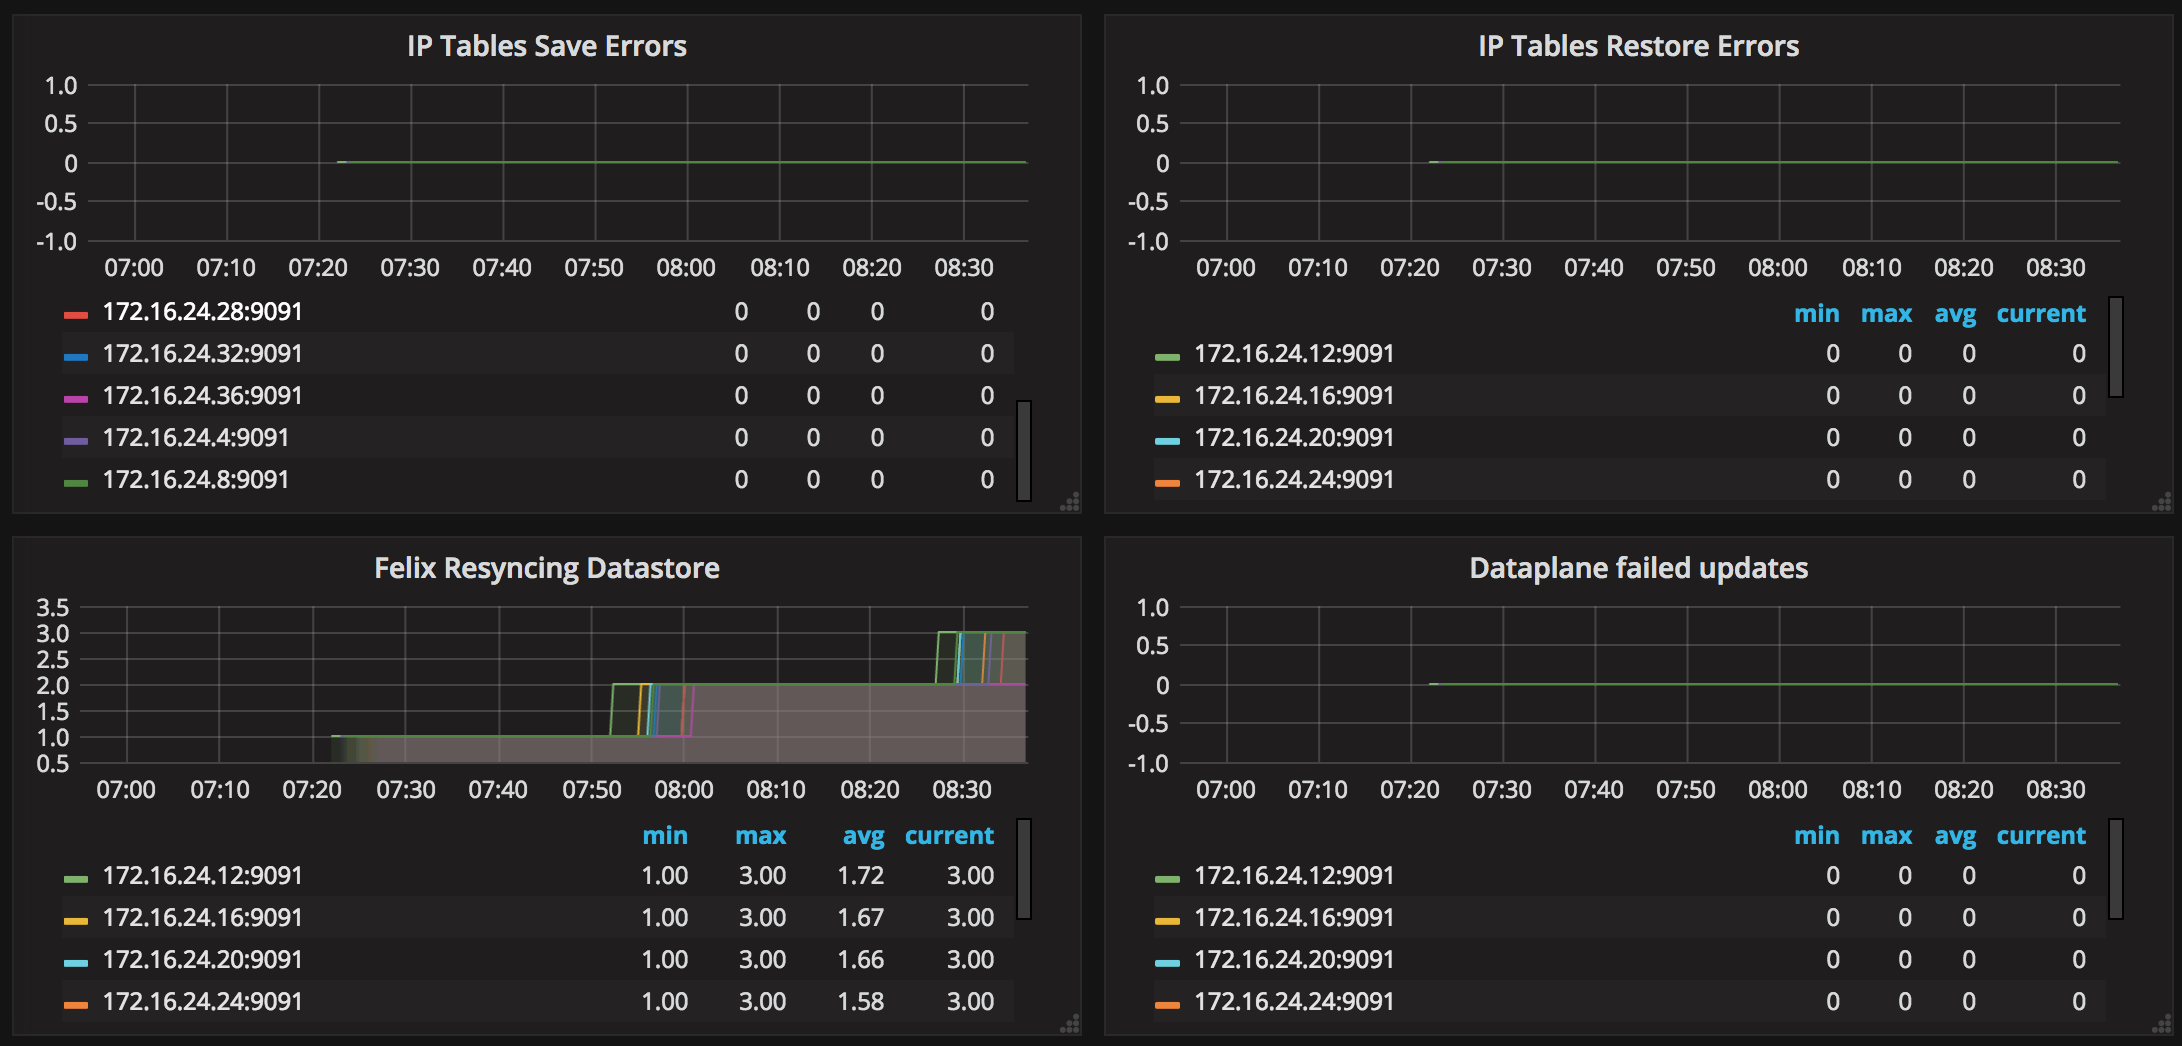
This dashboard monitors Kubernetes networking with a focus on Calico metrics, providing visibility into pod-to-pod and node-to-node traffic, policy enforcement, and network performance. It highlights key metrics such as calico_flows_total (traffic counts), felix_active_nodes (node readiness for policy application), and calico_policy_server_status (policy enforcement health), complemented by panel-level visual cues for alerts and time-range driven summaries to detect anomalies quickly.
Screenshots

Get Dashboard✕
Download
Copy to Clipboard