Kubernetes App Metrics 11,094,77911,094,779 4.5 (4 reviews)
2/9/2017
2/9/2017
1
Docker
>=4.1.1
Prometheus
Description
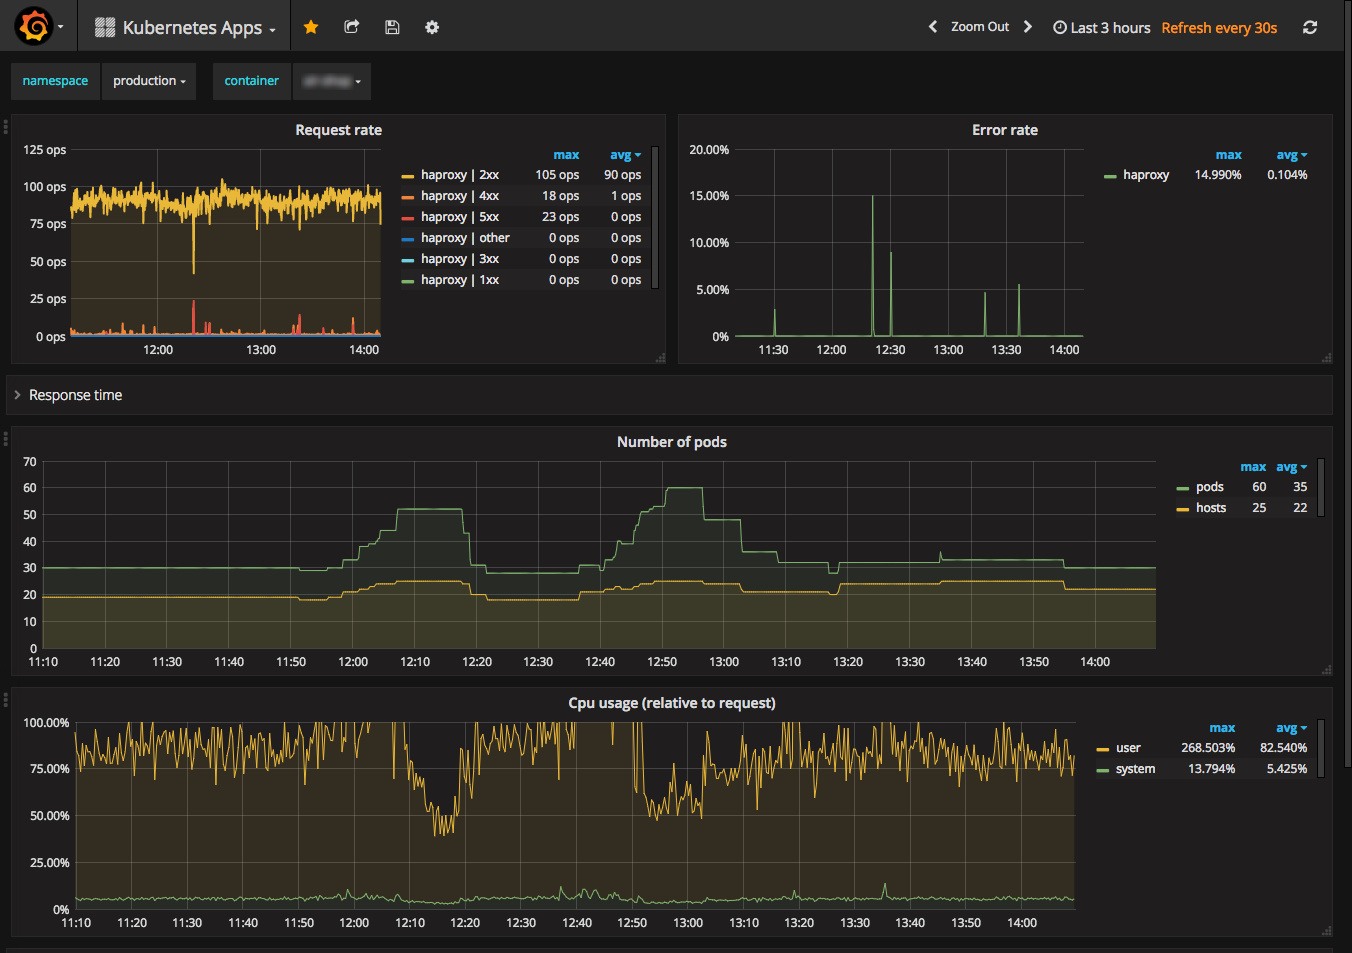
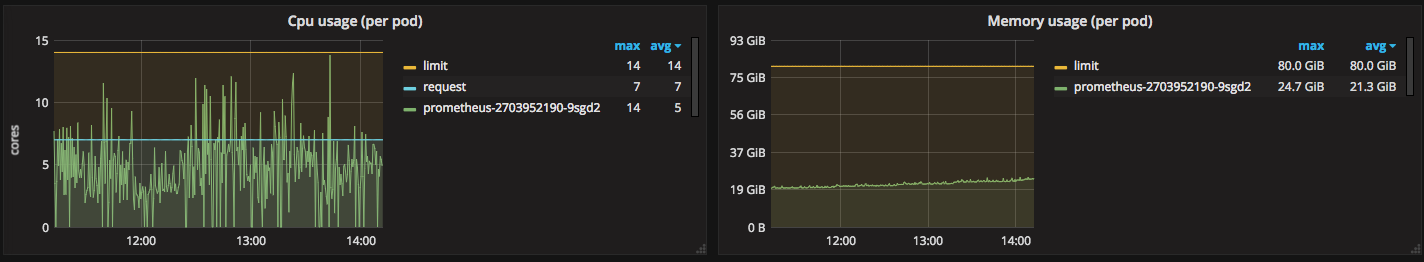
This dashboard monitors core Kubernetes app metrics to assess application health and performance. It focuses on latency and error characteristics, throughput, and resource utilization, using panels that surface key signals like http_request_duration_seconds_sum (and its rate) for latency, http_request_total for request count and error ratio, and container_memory_usage_bytes / container_cpu_usage_seconds_total for pod resource consumption. Together, these panels enable fast triage of latency spikes, error bursts, and CPU/memory pressure across deployments.
Screenshots
Get Dashboard✕
Download
Copy to Clipboard