Kubernetes apiserver 7,305,9187,305,918
3/31/2020
3/31/2020
1
AWS
>=6.6.2
Description
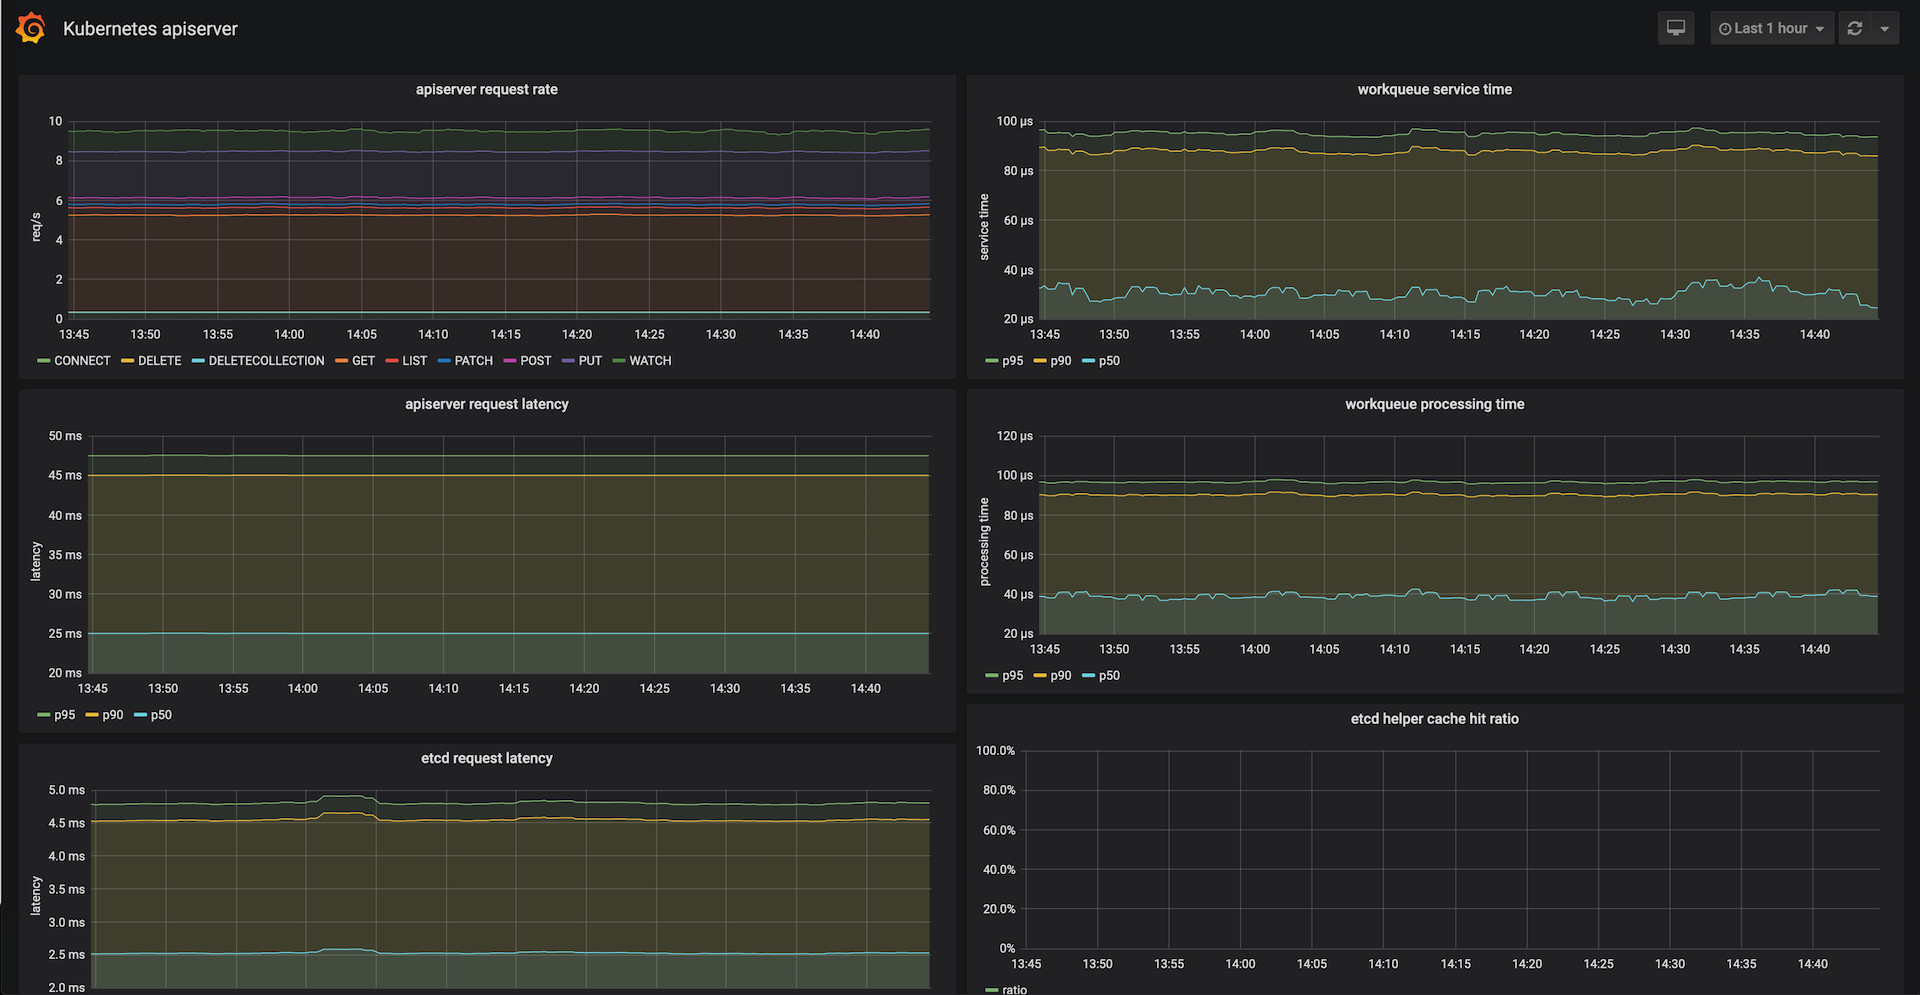
Monitors Kubernetes API server performance and latency, highlighting request rates, processing times, and cache efficiency. Key metrics include apiserver_request_total for throughput, apiserver_request_duration_seconds_bucket for latency distribution, and etcd_helper_cache_hit_total/etcd_helper_cache_miss_total to gauge etcd cache effectiveness. Panels also show workqueue timing and etcd request latency to provide end-to-end visibility of request handling and storage interaction.
Screenshots
Used Metrics 77
apiserver_request_duration_seconds_bucket
apiserver_request_total
etcd_helper_cache_hit_total
etcd_helper_cache_miss_total
etcd_request_duration_seconds_bucket
workqueue_queue_duration_seconds_bucket
workqueue_work_duration_seconds_bucket
Get Dashboard✕
Download
Copy to Clipboard