Kubecost Dashboard for Grafana Cloud 2,0402,040
Description
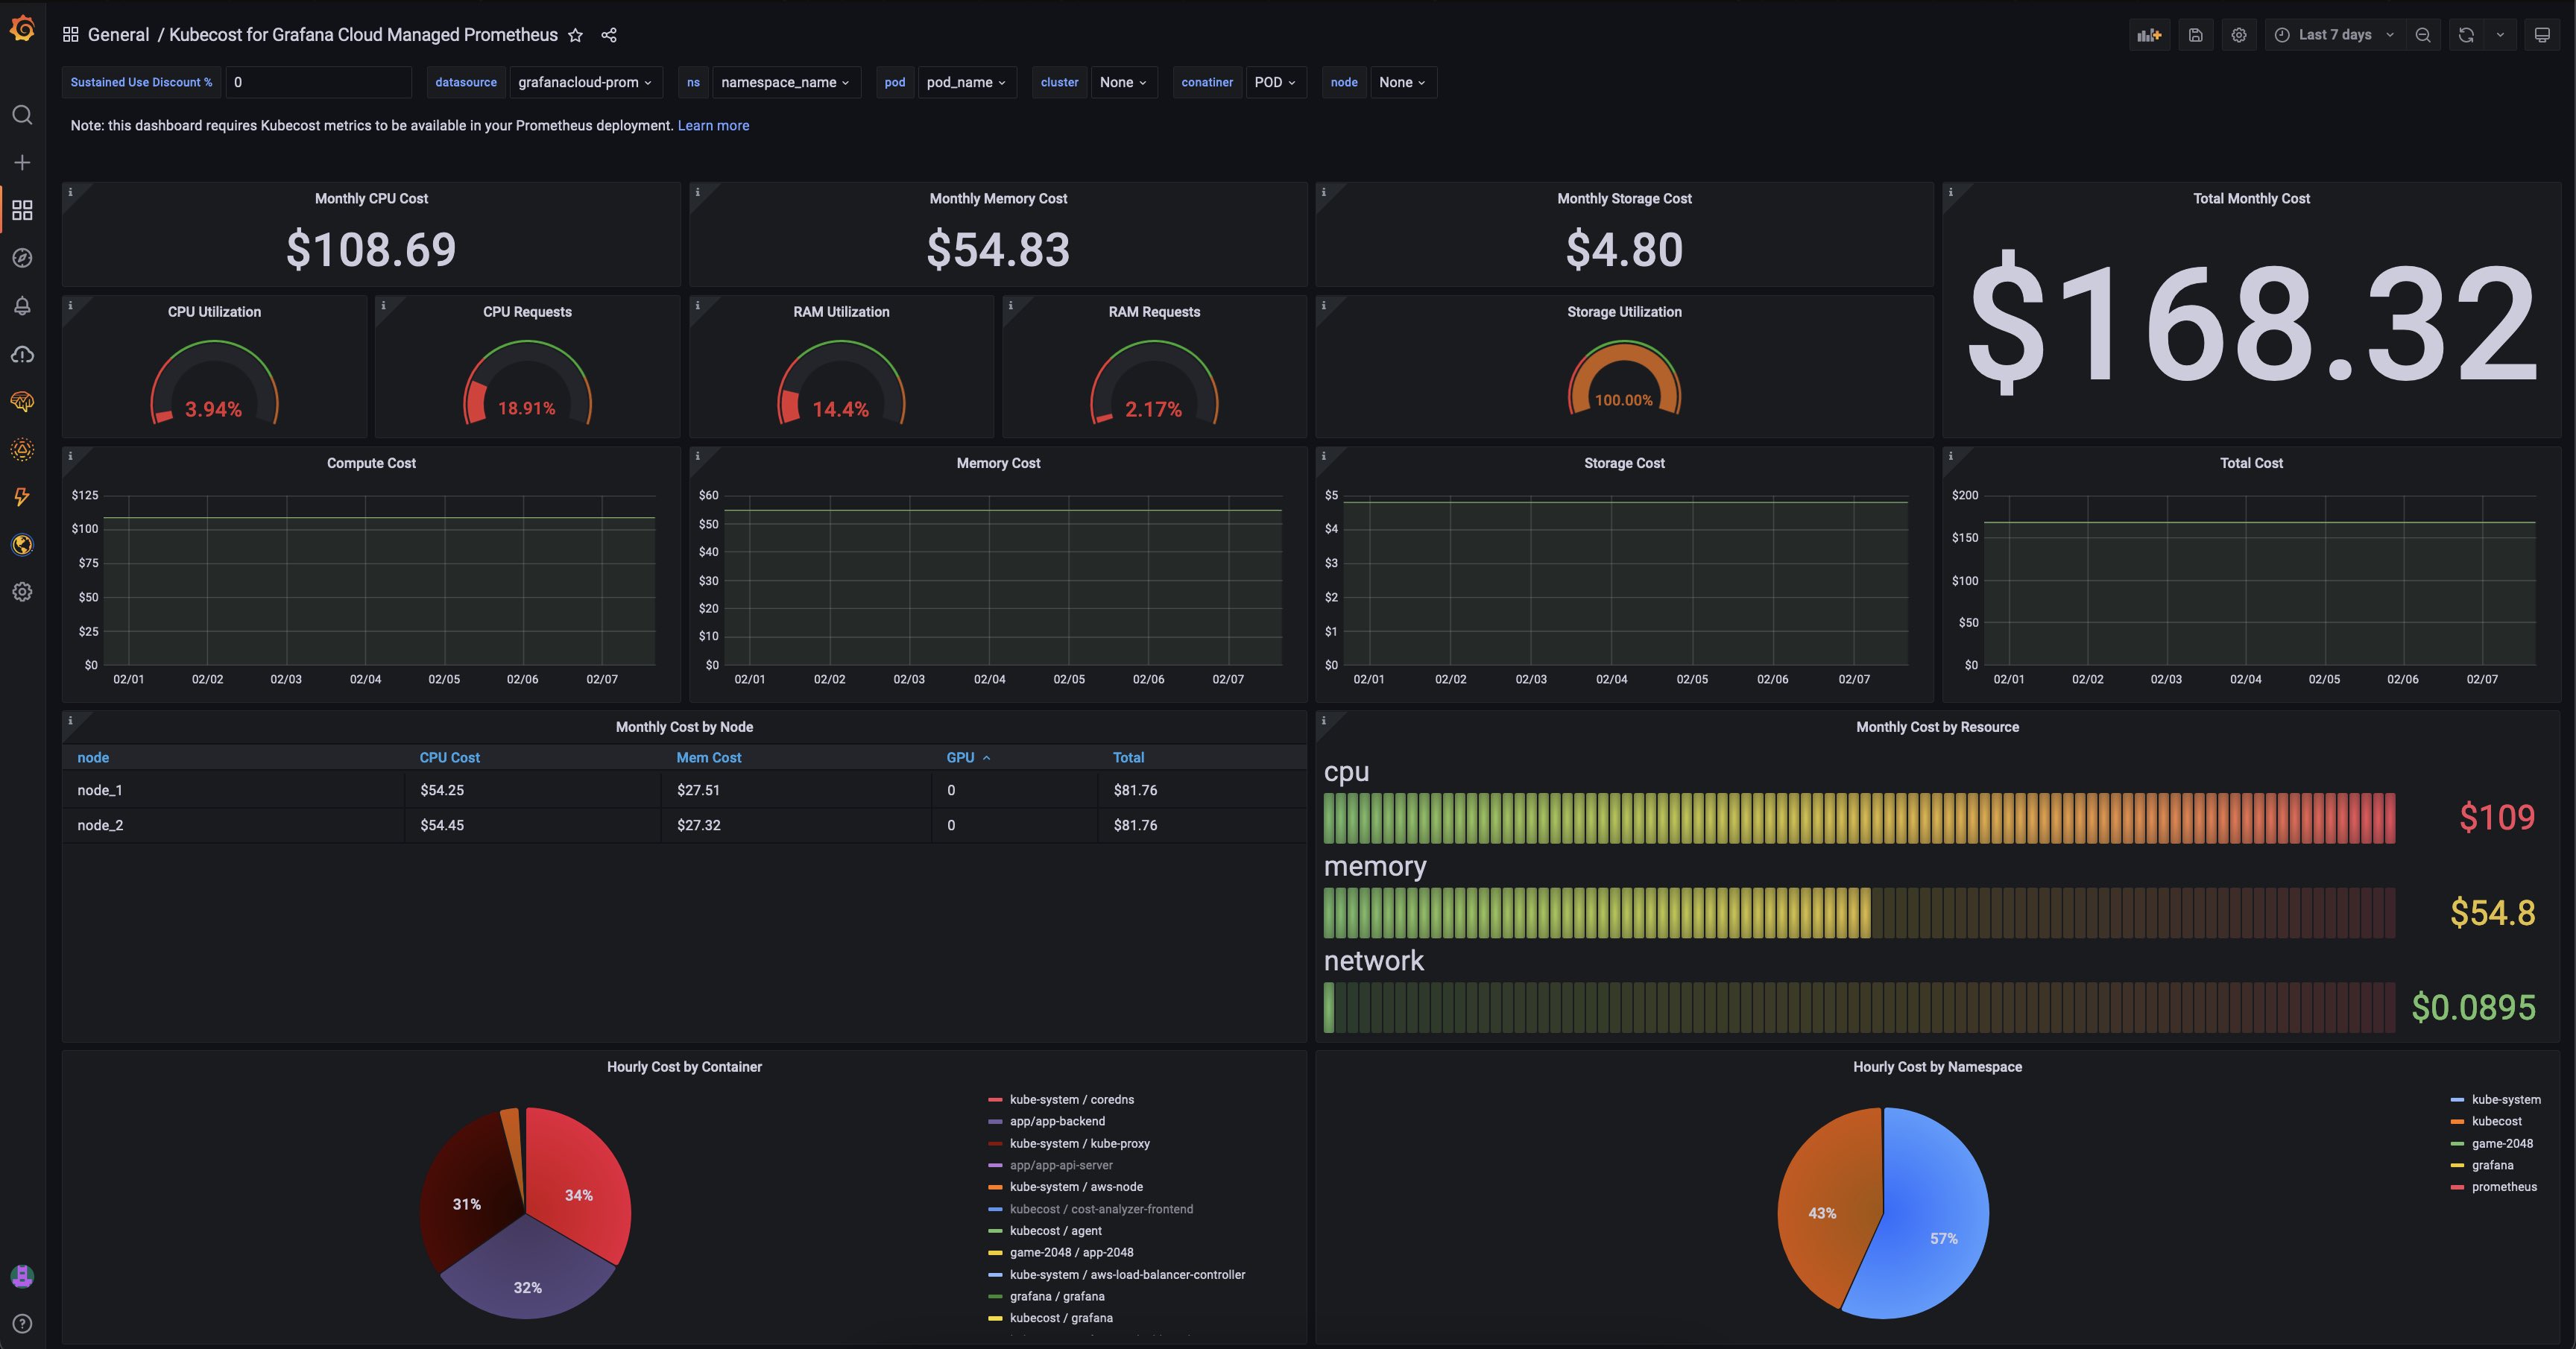
Cluster cost overview for Kubecost running Grafana Cloud's Managed Prometheus in the backend.
Screenshots
Used Metrics 3232
CPU
Compute
GPU
Memory
Storage
container_cpu_allocation
-
container_cpu_usage_seconds_total
-
container_fs_limit_bytes
-
container_fs_usage_bytes
container_memory_allocation_bytes
-
container_memory_working_set_bytes
egressCost
instance_type
kube_node_labels
kube_node_status_allocatable
kube_node_status_capacity
kube_persistentvolume_capacity_bytes
kube_persistentvolumeclaim_info
kube_persistentvolumeclaim_resource_requests_storage_bytes
kube_pod_container_resource_requests
label_node_kubernetes_io_instance_type
localStorageGBCost
node_cpu_hourly_cost
node_gpu_hourly_cost
-
node_network_transmit_bytes_total
node_ram_hourly_cost
percentEgress
pod_pvc_allocation
pv_hourly_cost
timeRange
-
up
useDiscount