KubeCost 215,207215,207
11/25/2019
9/16/2020
3
>=7.1.4
Prometheus
Description
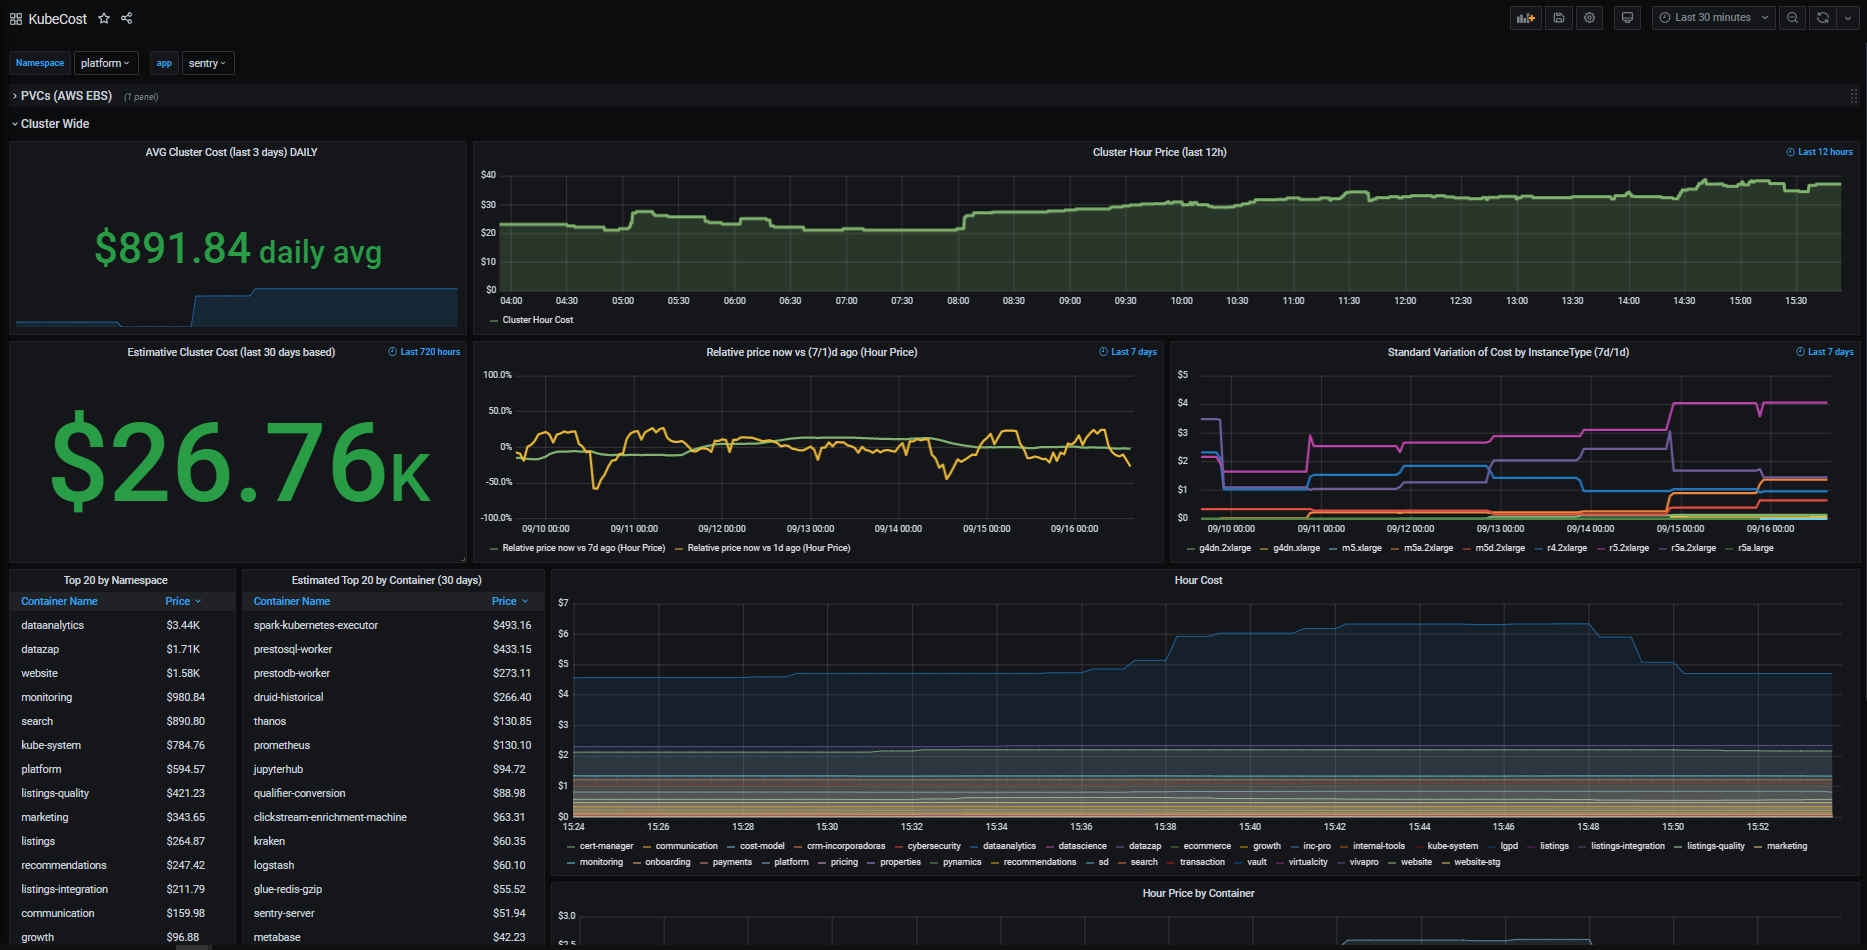
This dashboard monitors cloud costs across a Kubernetes cluster, aggregating hourly and daily cost data to reveal spending patterns and cost drivers. It highlights top cost contributors, compares hourly price vs. past periods, and provides granular per-container and per-node cost insights. Key metrics include node_total_hourly_cost, node_ram_hourly_cost, and container_cpu_allocation (with supporting context from topk, instance_type, and label_node_kubernetes_io_instance_type to identify hotspots and allocation efficiency.
Screenshots
Used Metrics 1010
:
container_cpu_allocation
container_memory_allocation_bytes
instance_type
kube_node_labels
label_node_kubernetes_io_instance_type
node_cpu_hourly_cost
node_ram_hourly_cost
node_total_hourly_cost
topk
Get Dashboard✕
Download
Copy to Clipboard