Kube State Metrics v2 4,0854,085
Description
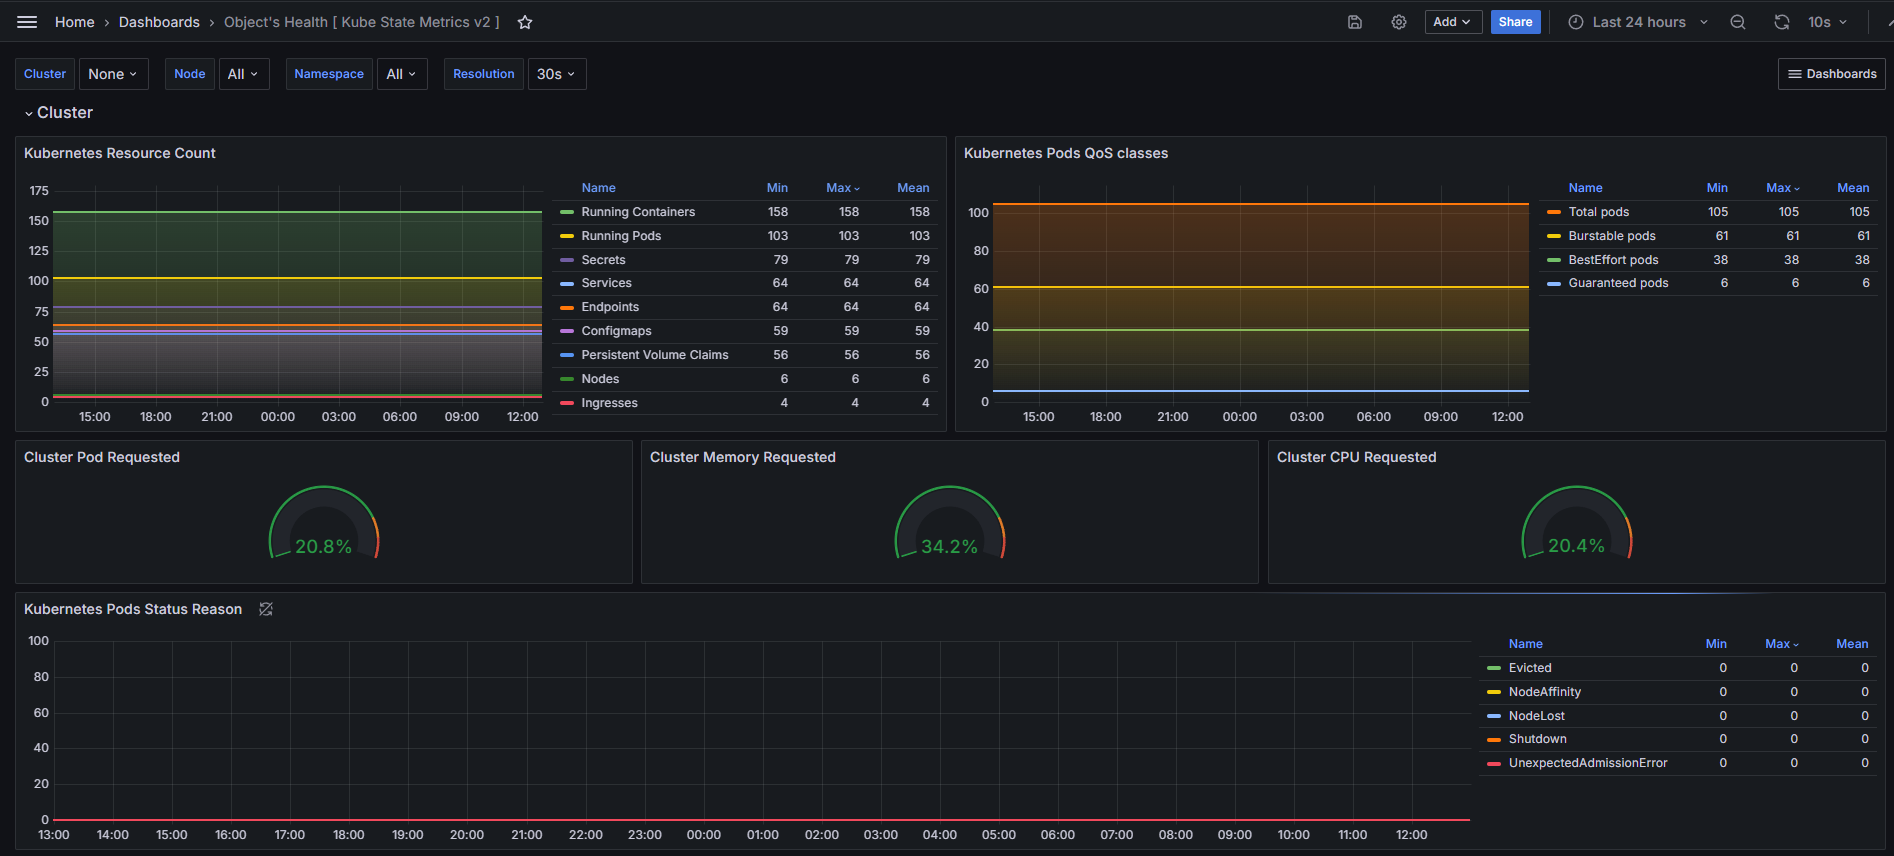
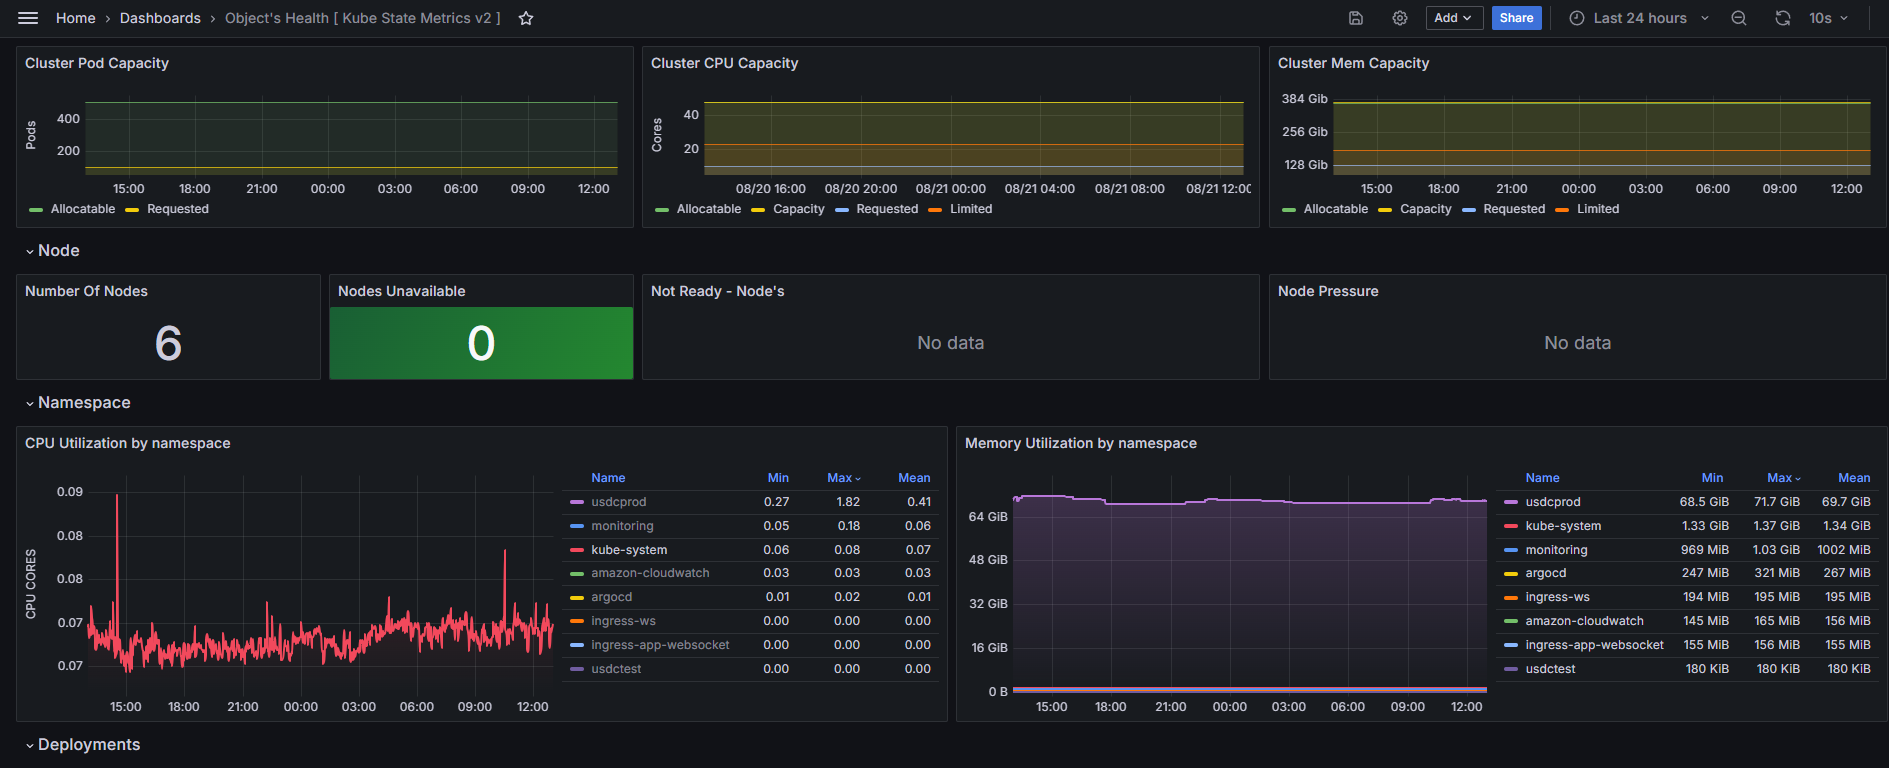
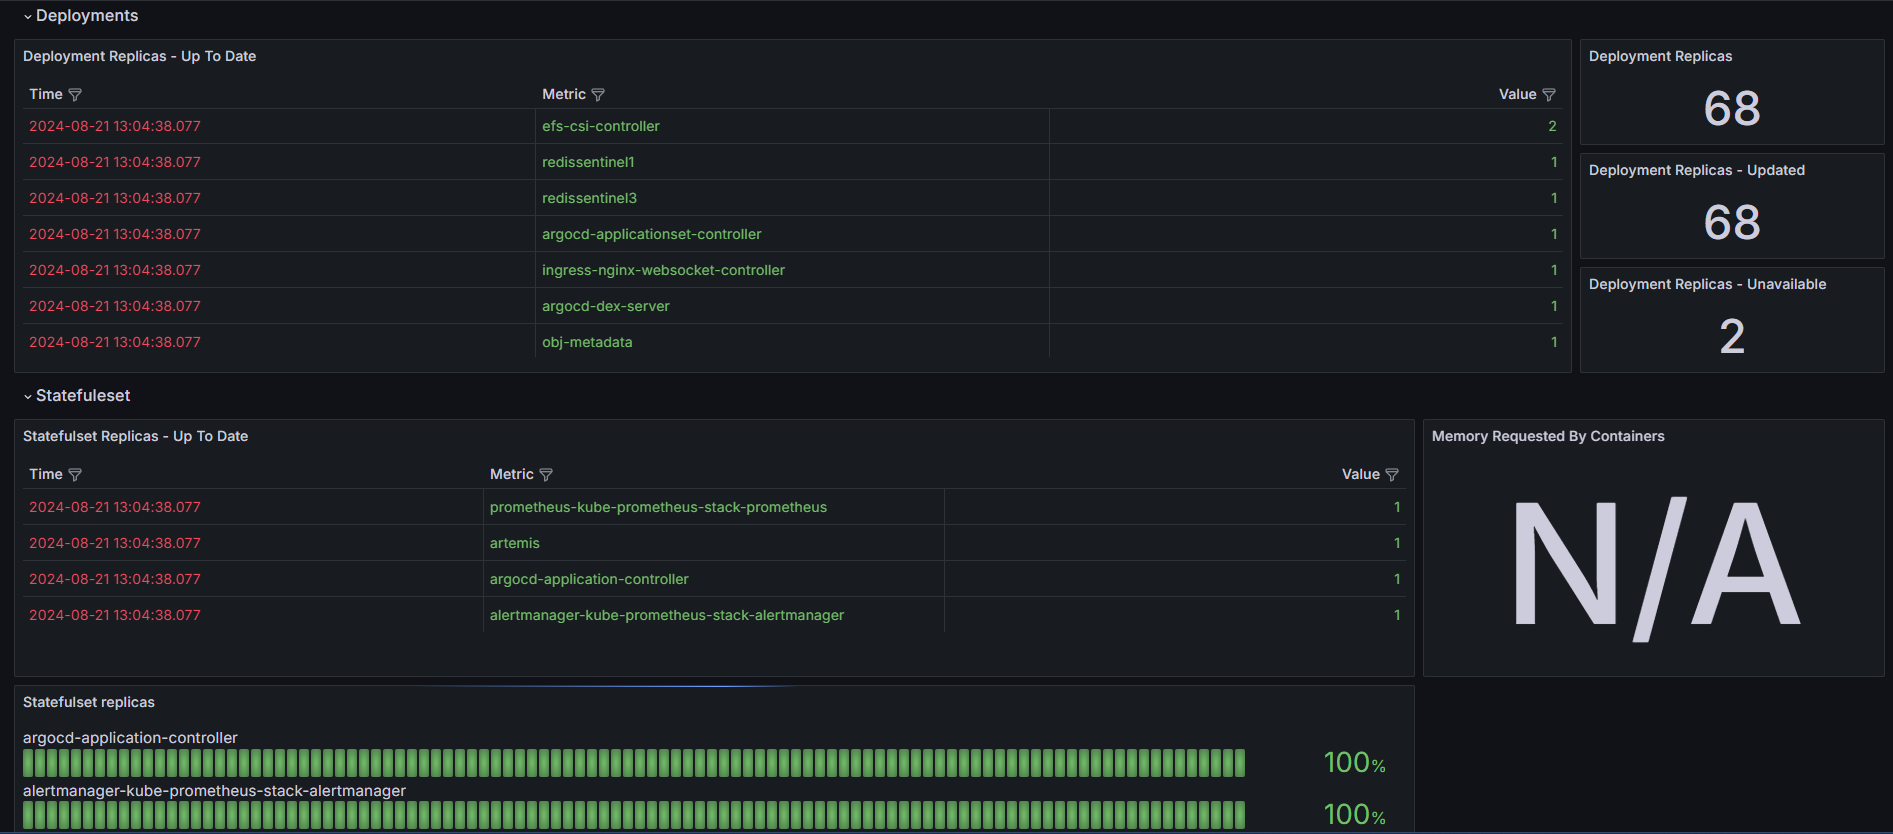
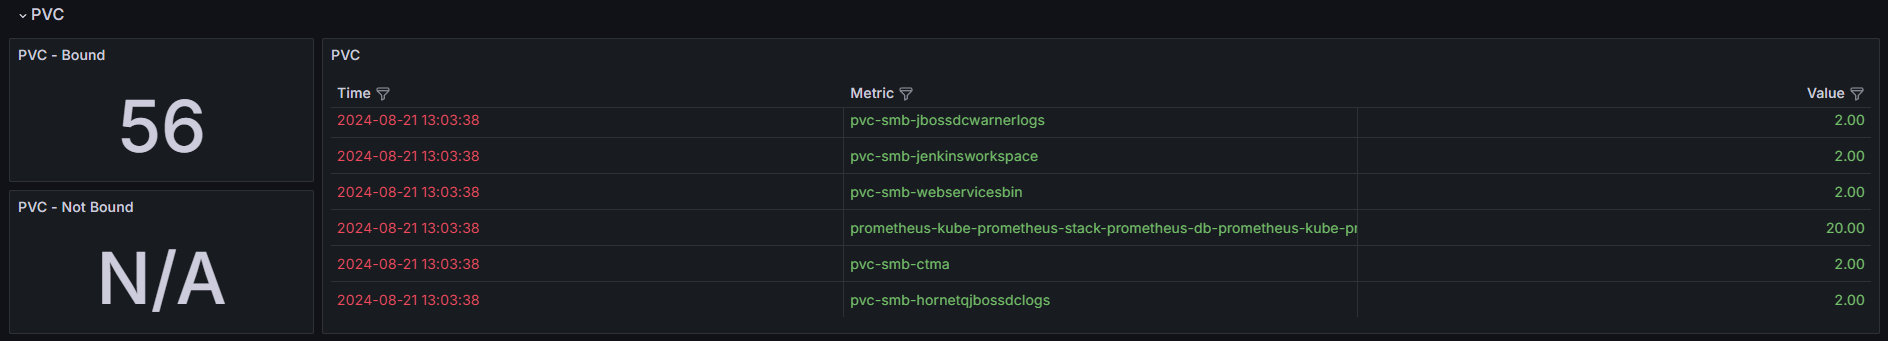
This Grafana dashboard provides a comprehensive overview of the state and performance of Kubernetes resources within your cluster, with a focus on resource counts, utilization, and availability. It covers key metrics across nodes, namespaces, pods, and containers, making it easier to monitor and troubleshoot your cluster effectively.
Screenshots
Used Metrics 2929
-
container_cpu_usage_seconds_total
-
container_memory_working_set_bytes
kube_configmap_info
kube_daemonset_labels
kube_deployment_labels
kube_deployment_status_replicas
kube_deployment_status_replicas_unavailable
kube_deployment_status_replicas_updated
kube_endpoint_info
kube_hpa_labels
kube_ingress_info
kube_namespace_labels
kube_networkpolicy_labels
kube_node_info
kube_node_spec_unschedulable
kube_node_status_allocatable
kube_node_status_capacity
kube_node_status_condition
kube_persistentvolumeclaim_info
kube_pod_container_resource_limits
kube_pod_container_resource_requests
kube_pod_container_status_running
kube_pod_info
kube_pod_status_phase
kube_pod_status_qos_class
kube_pod_status_reason
kube_secret_info
kube_service_info
kube_statefulset_labels