kube-state-metrics-v2 29,748,85129,748,851 5.0 (4 reviews)
11/3/2020
9/7/2022
12
>=7.1.1
Prometheus
Description
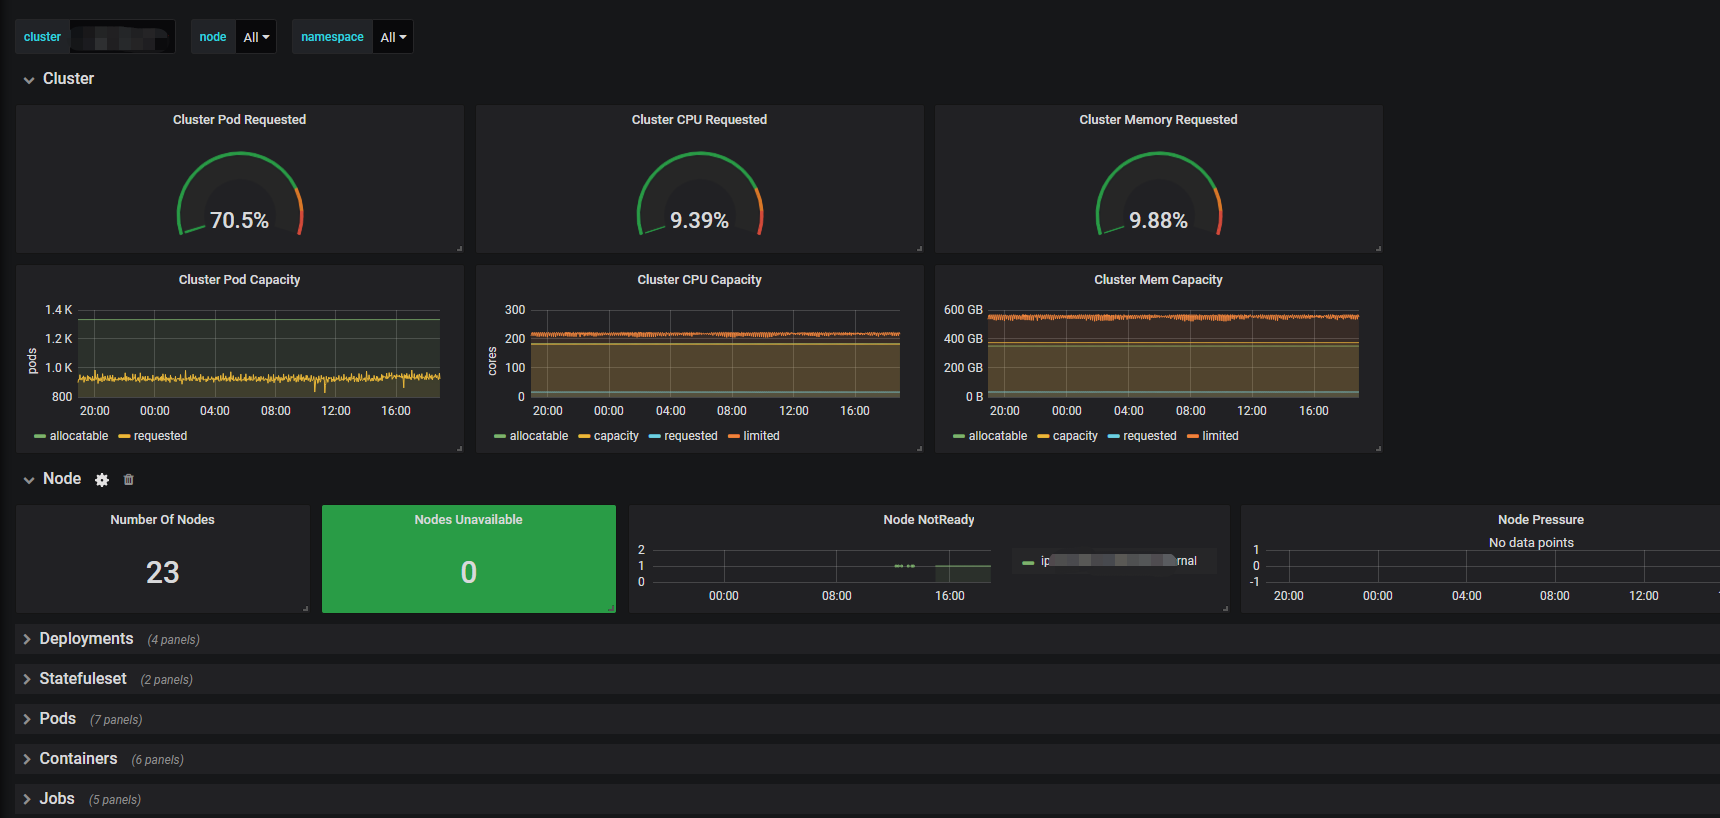
This dashboard provides an at-a-glance view of Kubernetes cluster resource usage and capacity by aggregating pod, node, and container request/limit metrics. It highlights requested vs. capacity across CPU, memory, and pod workloads, helping operators detect resource imbalances, saturation, and capacity planning needs across the entire cluster.
Screenshots
Used Metrics 55
kube_node_status_allocatable
kube_node_status_capacity
kube_pod_container_resource_limits
kube_pod_container_resource_requests
kube_pod_info
Get Dashboard✕
Download
Copy to Clipboard