Kong Vitals Prometheus (official) 3,0503,050
3/9/2020
9/11/2023
6
>=6.1.6
Prometheus
Description
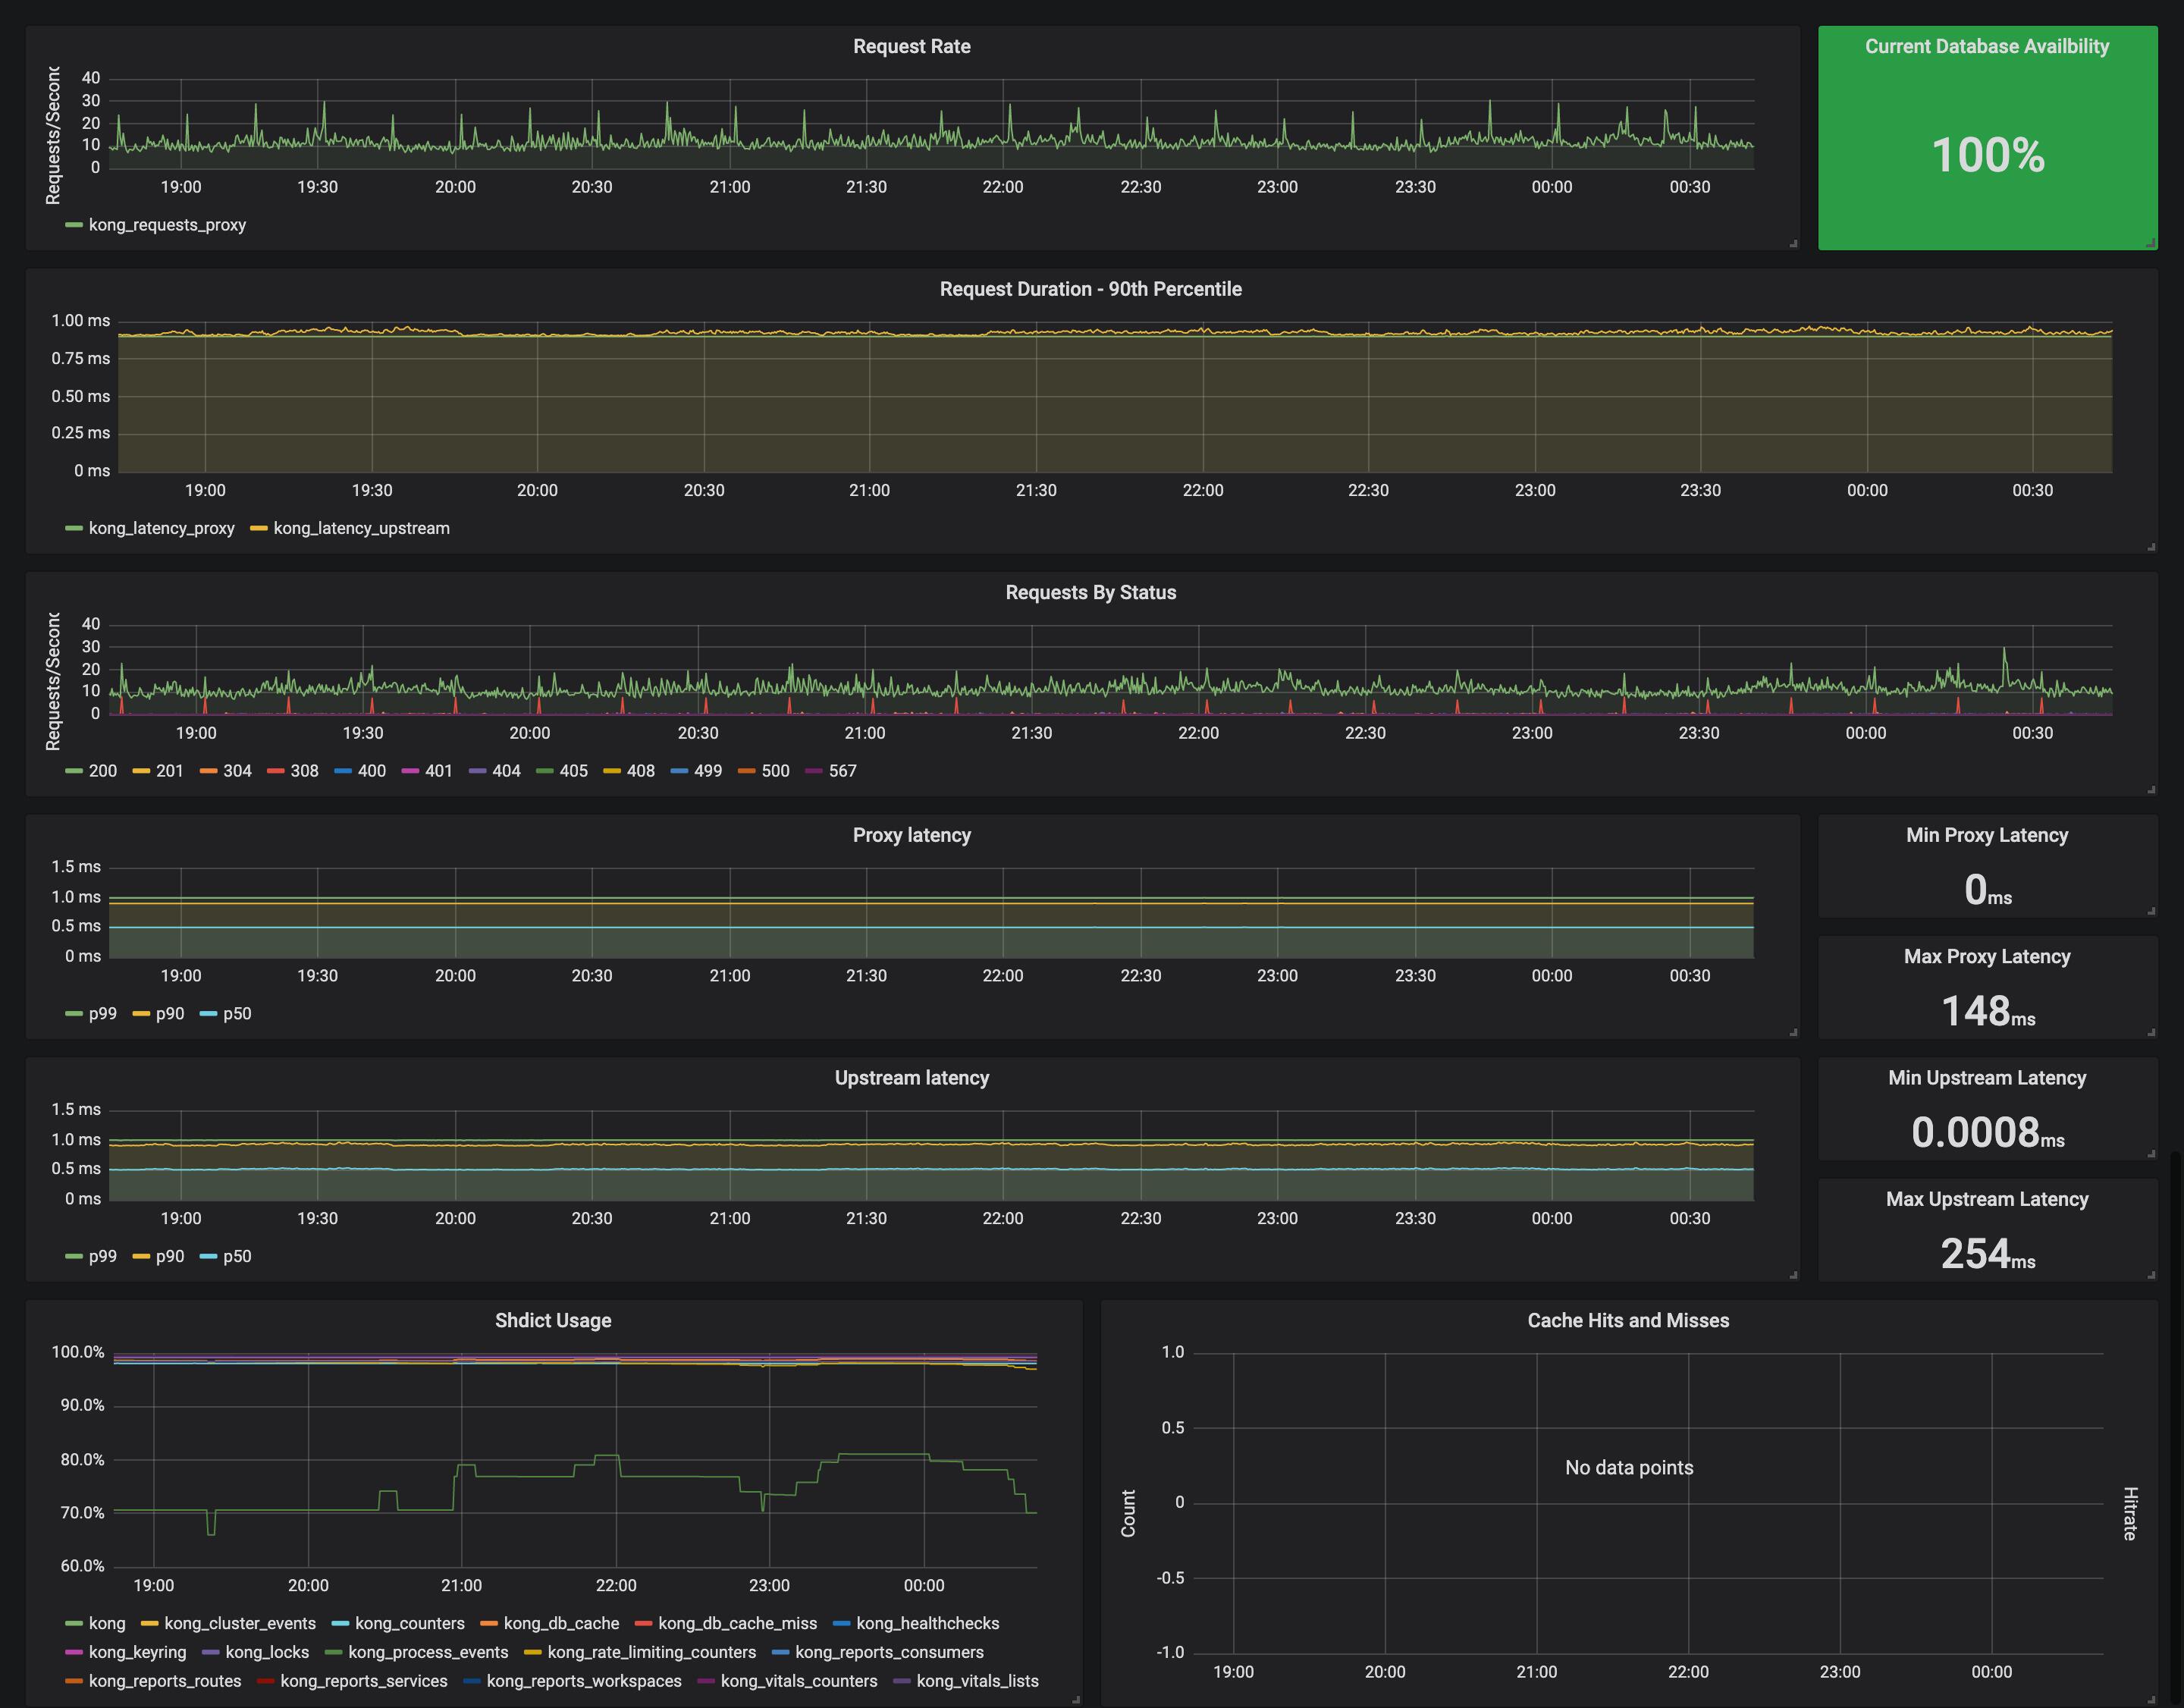
Dashboard that graphs metrics exported via Kong Enterprise Vitals Prometheus (https://docs.konghq.com/enterprise/1.3-x/admin-api/vitals/vitals-prometheus-strategy/)
Screenshots
Used Metrics 1313
kong_cache_datastore_hits_total
kong_cache_datastore_misses_total
kong_cache_misses_total
kong_latency_proxy_request_bucket
kong_latency_proxy_request_max
kong_latency_proxy_request_min
kong_latency_upstream_bucket
kong_latency_upstream_max
kong_latency_upstream_min
kong_requests_proxy
kong_shdict_capacity
kong_shdict_free_space
kong_status_code
Get Dashboard✕
Download
Copy to Clipboard