Kong (official) 583,763583,763 2.6 (5 reviews)
8/8/2018
3/2/2023
11
>=8.4.5
Prometheus
Description
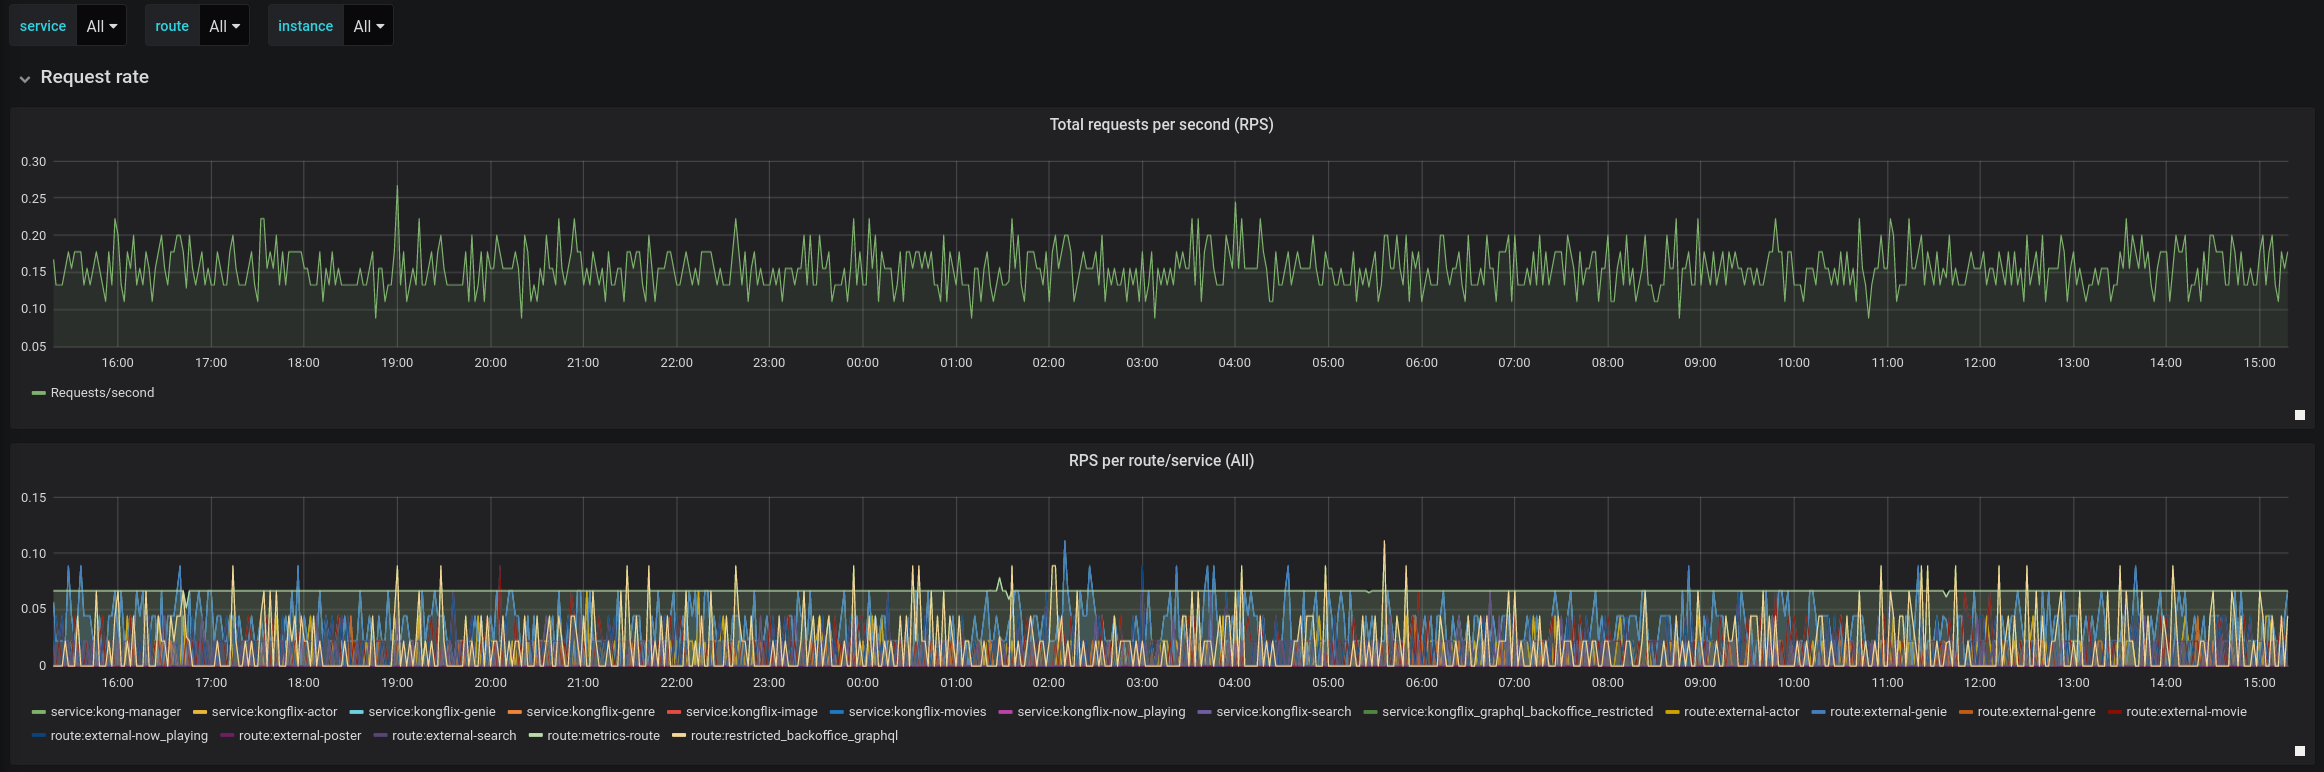
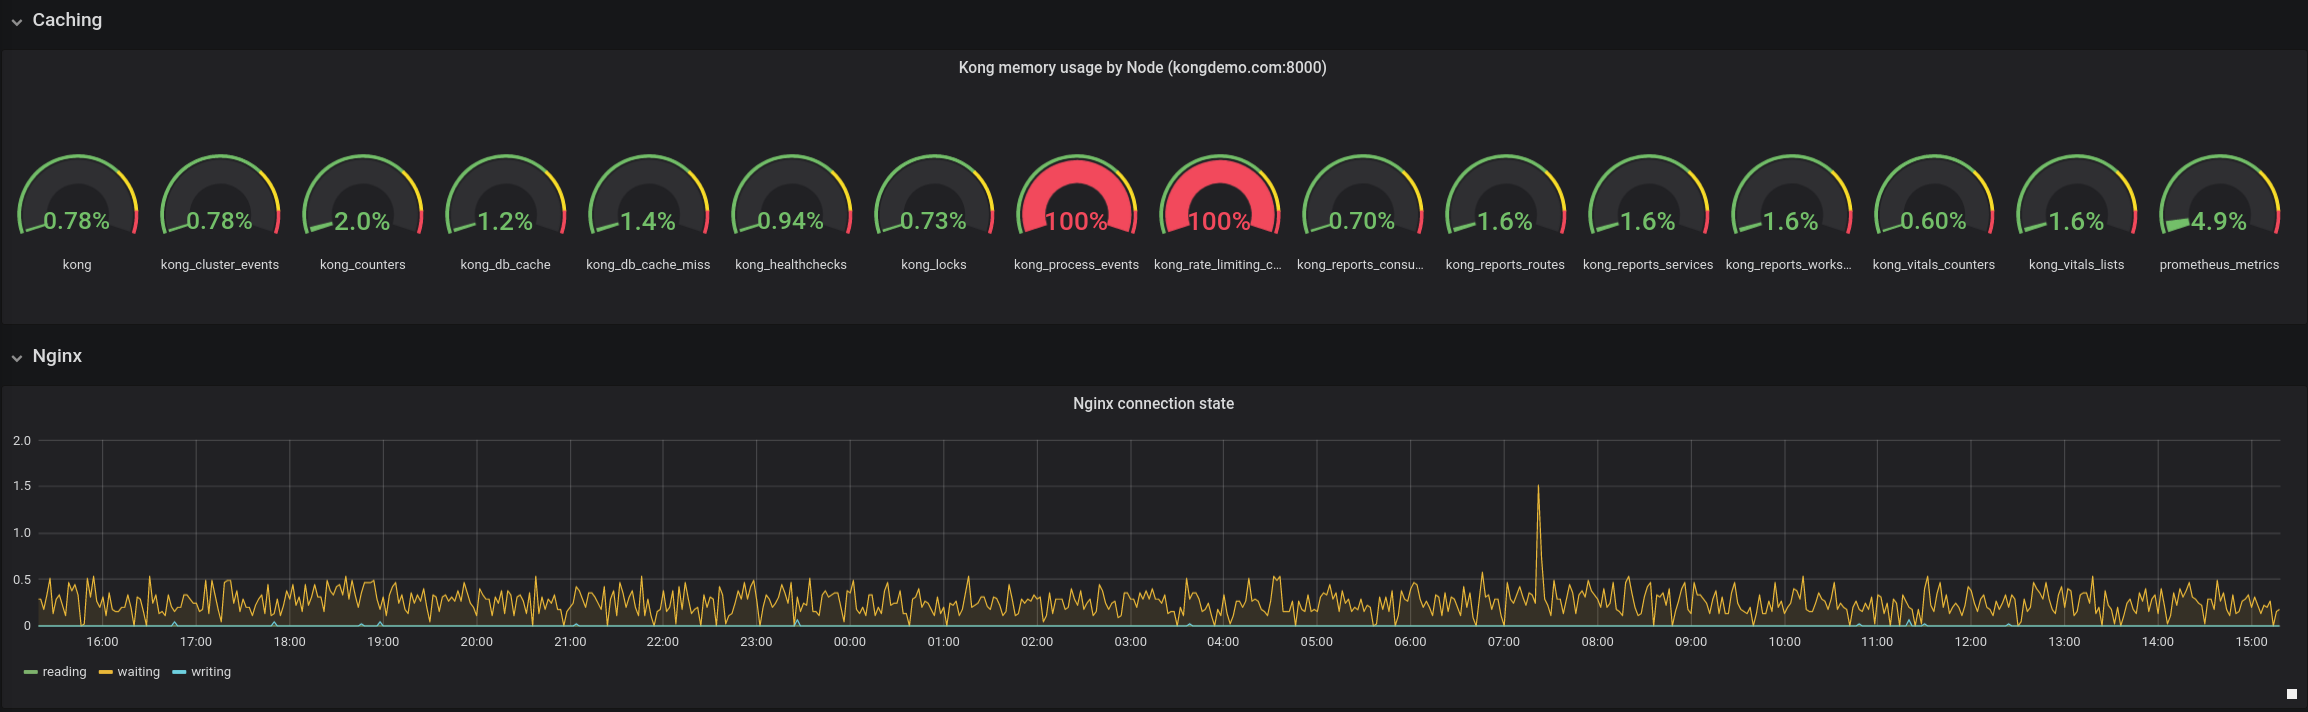
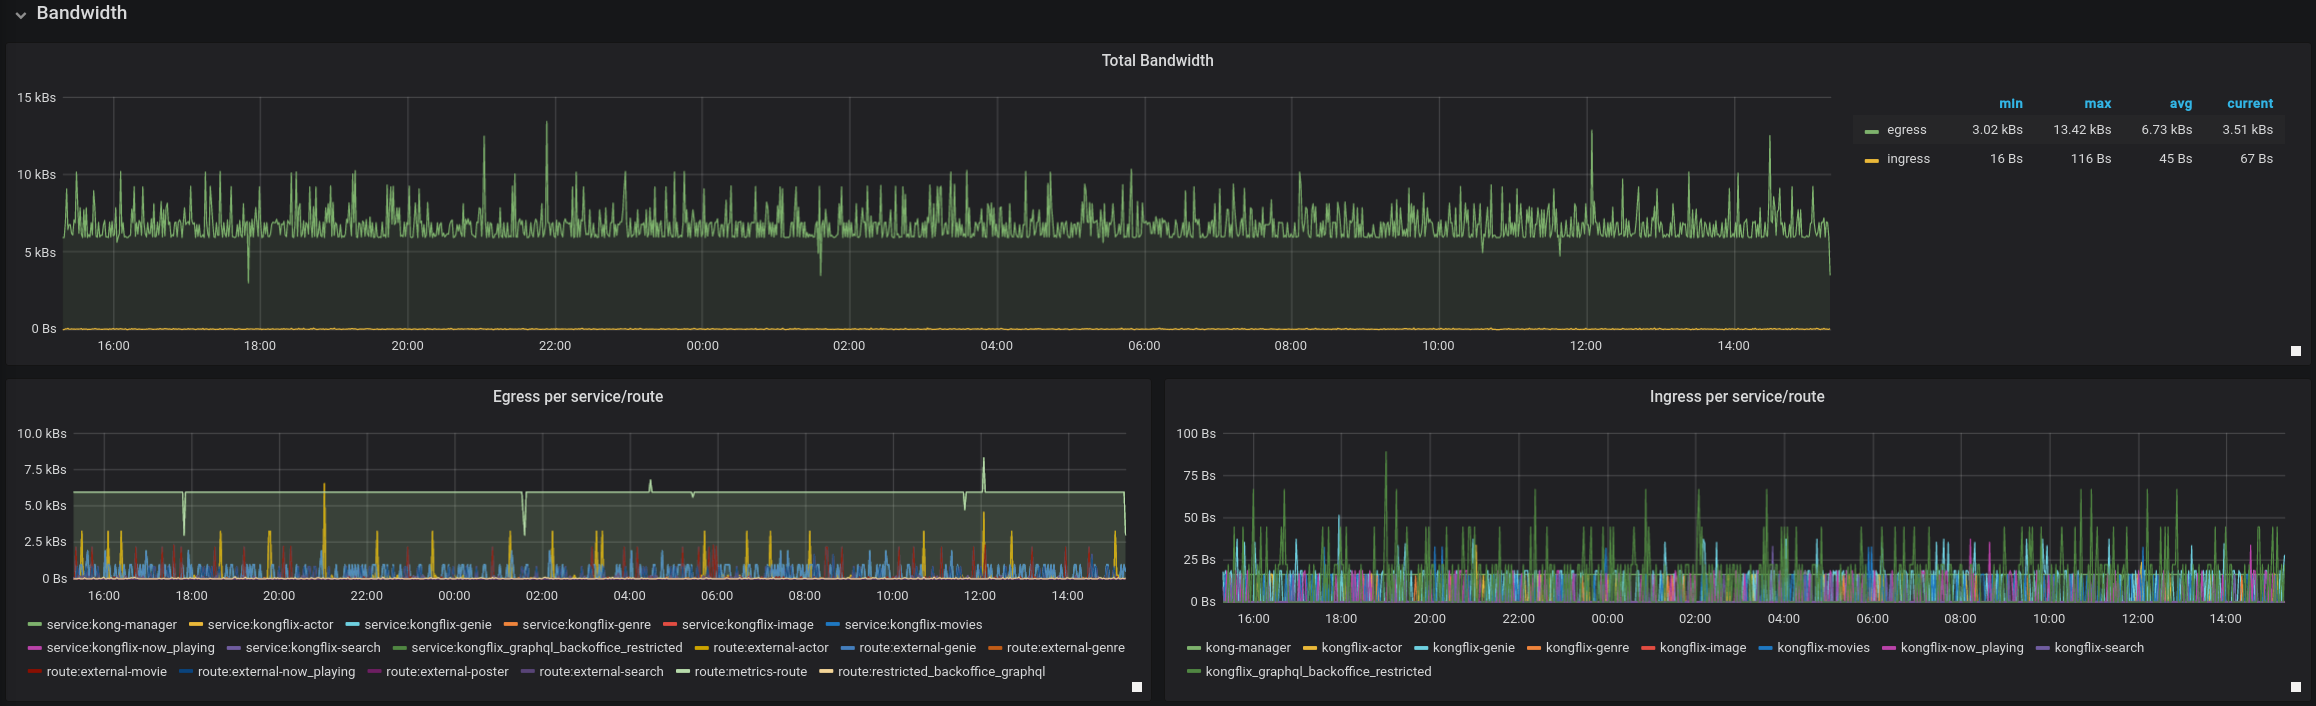
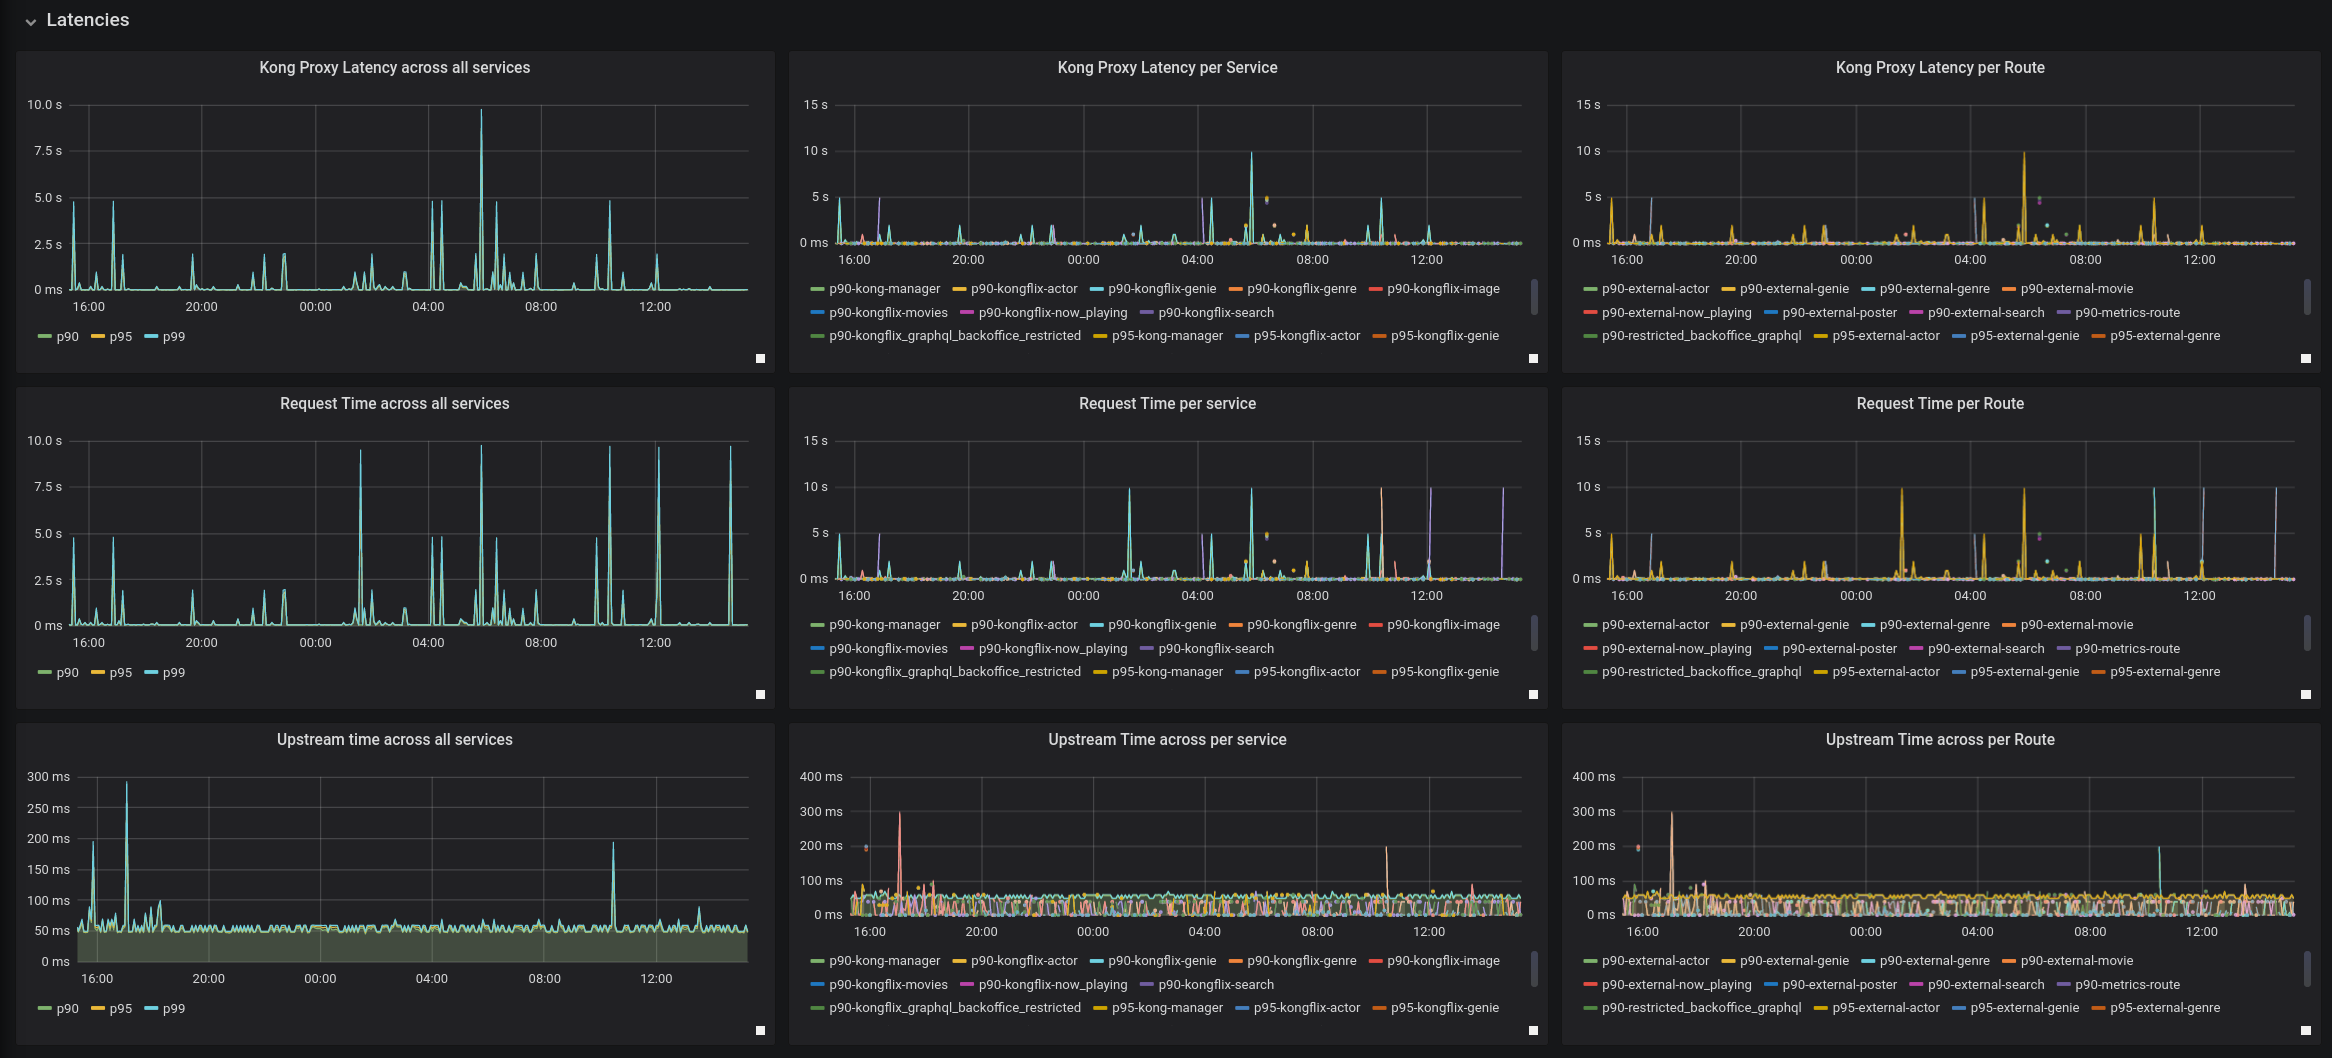
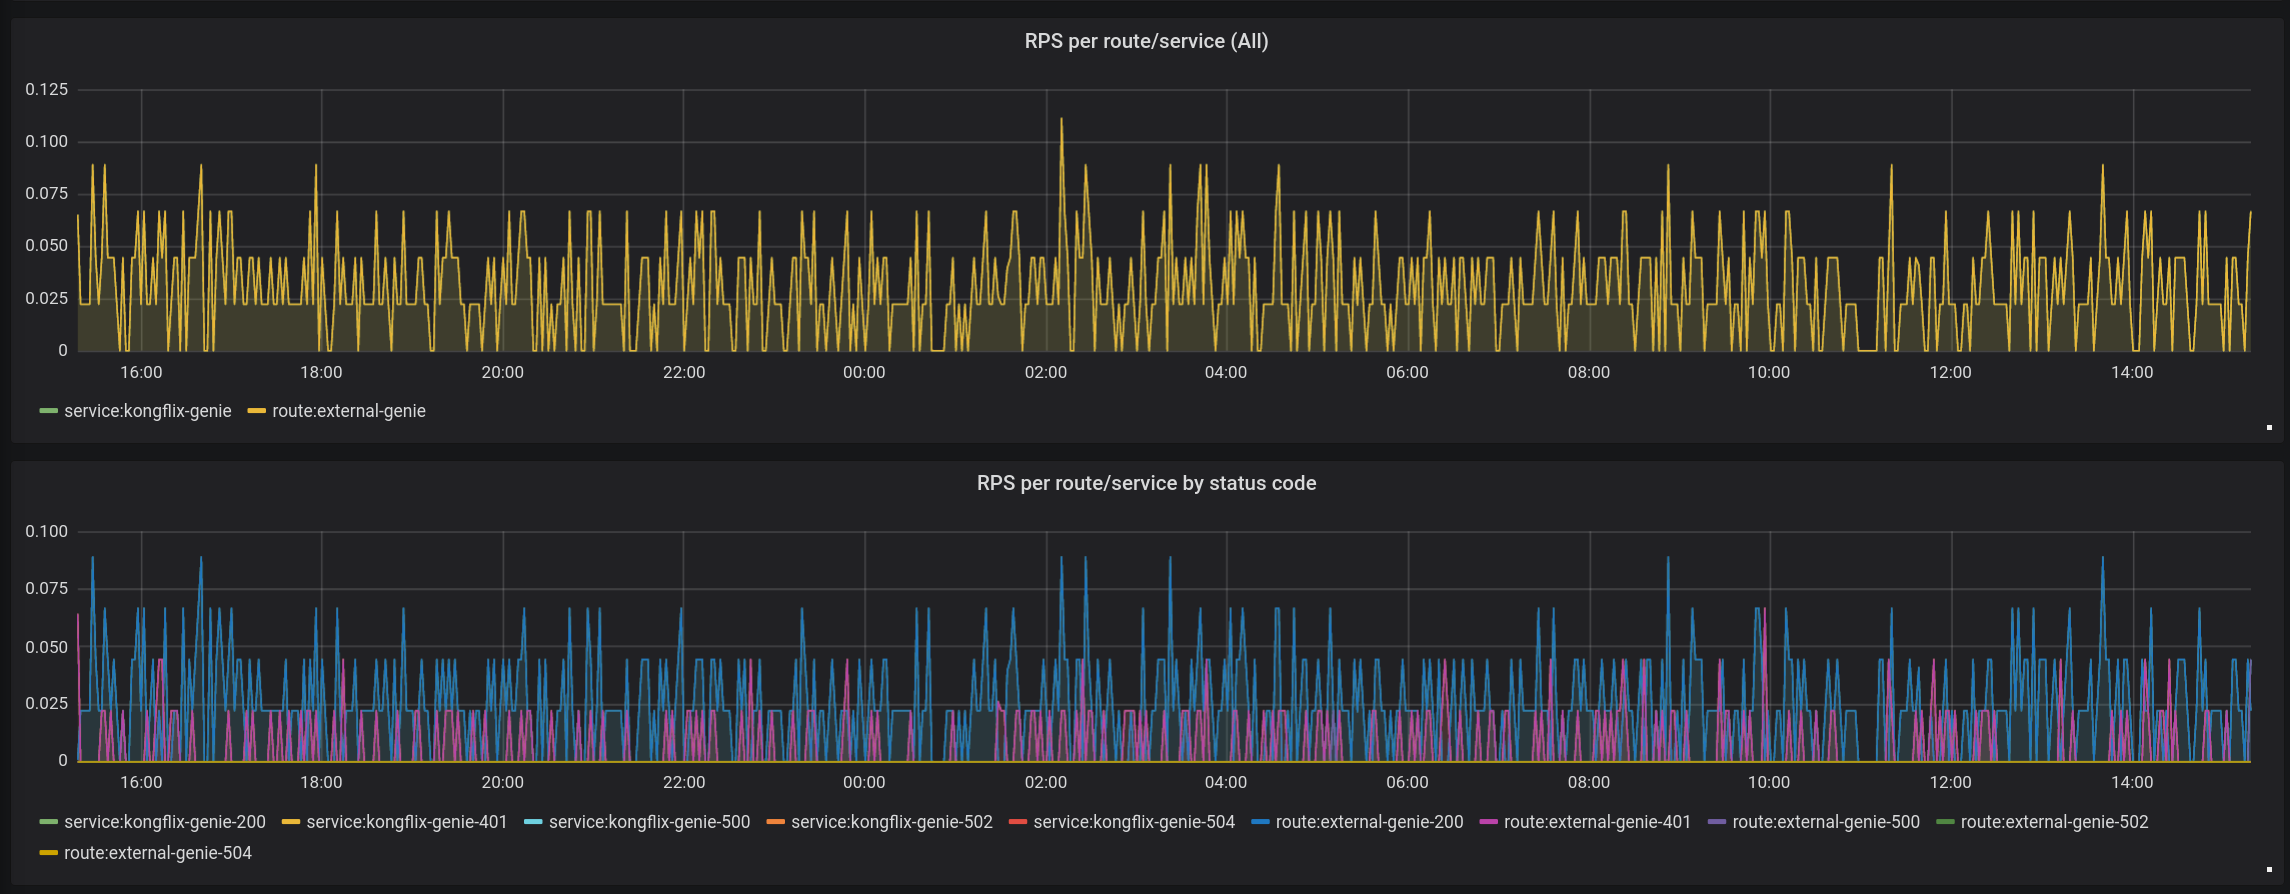
Monitors Kong gateway performance and reliability by aggregating key service metrics across routes, services, and upstreams. Highlights include latency and throughput analysis, error rates, and upstream health to identify bottlenecks and upstream failures. It leverages time-series visualizations and alerting-ready panels to track request per second, response latency, and status codes, enabling quick pinpointing of problematic services and routes.
Screenshots
Get Dashboard✕
Download
Copy to Clipboard