KMinion Consumer Group Dashboard - Prometheus Exporter for Apache Kafka 377,051377,051
3/5/2021
3/5/2021
1
>=7.3.6
Prometheus
Description
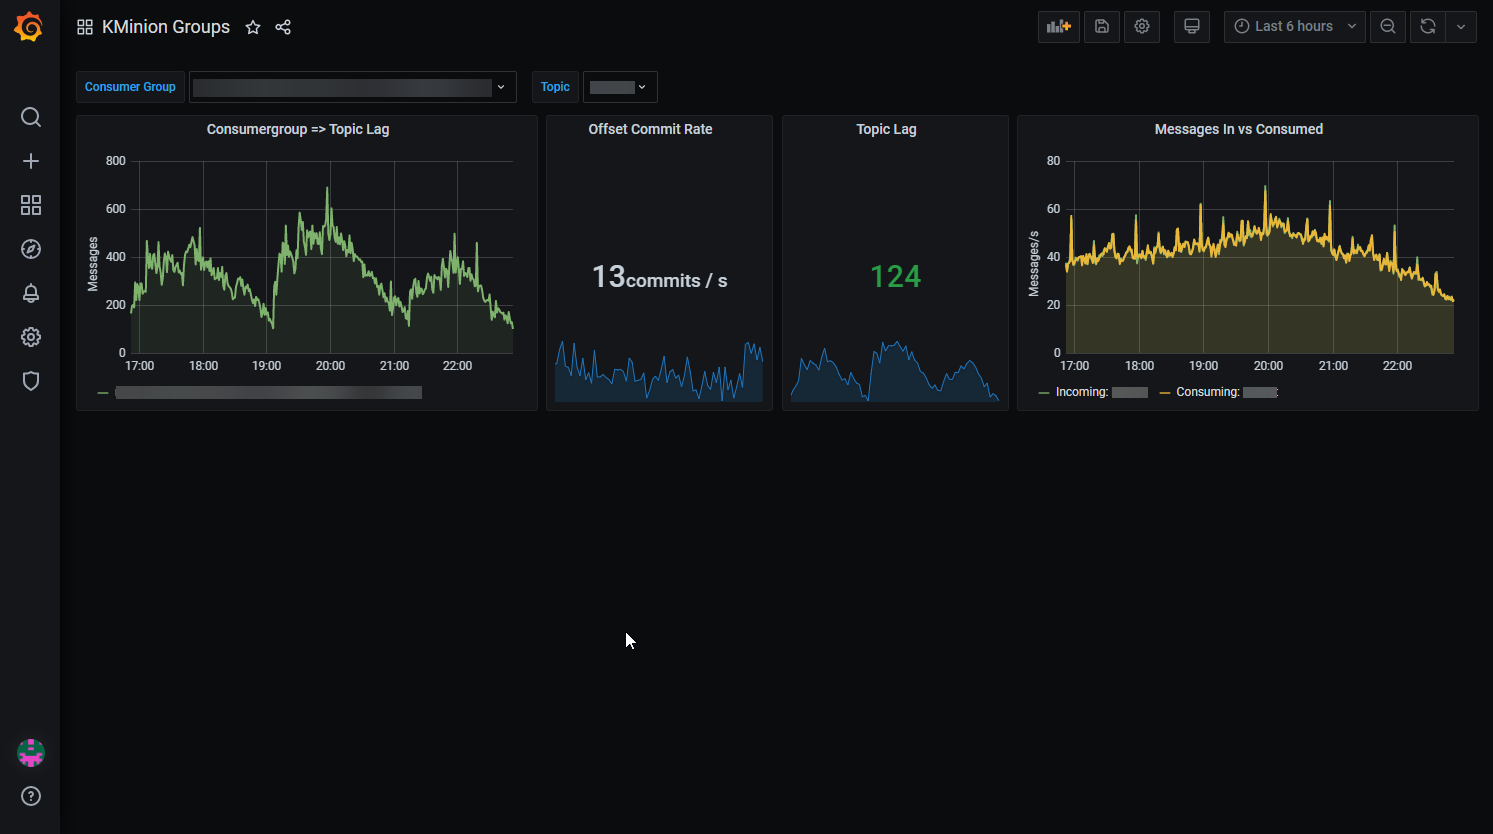
This dashboard monitors Kafka consumer group activity with a focus on lag, offset progress, and throughput. Key panels highlight kminion_kafka_consumer_group_topic_lag (lag per topic), kminion_kafka_consumer_group_offset_commits_total (offset commit rate), and kminion_kafka_consumer_group_topic_offset_sum alongside high water mark context via kminion_kafka_topic_high_water_mark_sum to assess how closely consumers keep up with topic progress.
Screenshots
Get Dashboard✕
Download
Copy to Clipboard